- Power BI forums
- Updates
- News & Announcements
- Get Help with Power BI
- Desktop
- Service
- Report Server
- Power Query
- Mobile Apps
- Developer
- DAX Commands and Tips
- Custom Visuals Development Discussion
- Health and Life Sciences
- Power BI Spanish forums
- Translated Spanish Desktop
- Power Platform Integration - Better Together!
- Power Platform Integrations (Read-only)
- Power Platform and Dynamics 365 Integrations (Read-only)
- Training and Consulting
- Instructor Led Training
- Dashboard in a Day for Women, by Women
- Galleries
- Community Connections & How-To Videos
- COVID-19 Data Stories Gallery
- Themes Gallery
- Data Stories Gallery
- R Script Showcase
- Webinars and Video Gallery
- Quick Measures Gallery
- 2021 MSBizAppsSummit Gallery
- 2020 MSBizAppsSummit Gallery
- 2019 MSBizAppsSummit Gallery
- Events
- Ideas
- Custom Visuals Ideas
- Issues
- Issues
- Events
- Upcoming Events
- Community Blog
- Power BI Community Blog
- Custom Visuals Community Blog
- Community Support
- Community Accounts & Registration
- Using the Community
- Community Feedback
Register now to learn Fabric in free live sessions led by the best Microsoft experts. From Apr 16 to May 9, in English and Spanish.
- Power BI forums
- Galleries
- Data Stories Gallery
- UK Public Sector Local & Regional Government
UK Public Sector Local & Regional Government
01-30-2017 05:00 AM - last edited 01-08-2018 09:55 AM


- Mark as New
- Bookmark
- Subscribe
- Mute
- Subscribe to RSS Feed
- Permalink
- Report Inappropriate Content
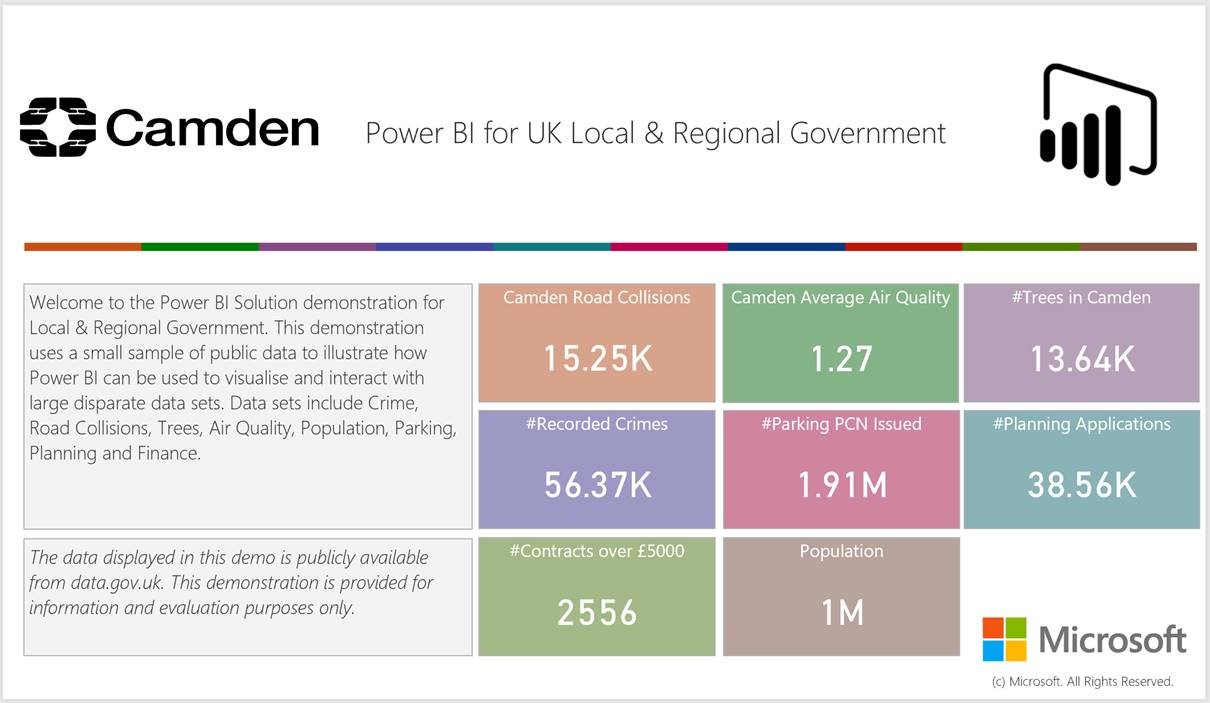
UK Public Sector Local & Regional Government
This Power BI demonstration is provided as an example of how a UK local or regional government organisation may use Power BI to visualise and interact with a wide range of data sets. This solution includes data from crime and traffic incidents to planning applications and tree preservation. Each of these data sets contains several years of real data. This information can be combined with internal data sets, such as those contained in on-premise databases for Finance, HR and Social Care, to create a comprehensive dashboard of local or regional government activities.
Data included in this demonstration is available from data.gov.uk and opendata.camden.gov.uk. Data is provided under the Open Government License.
(NOTE: The downloadable PBIX file contains only 2015 and 2016 data for all data sets due to upload file size limits. All data is available from the above open data sites above.)
eyJrIjoiZjRlMWUxMGMtNGZhNi00YzlhLTlkM2UtYzI0MzQ2M2YwYTk5IiwidCI6IjcyZjk4OGJmLTg2ZjEtNDFhZi05MWFiLTJkN2NkMDExZGI0NyIsImMiOjV9
- Mark as New
- Bookmark
- Subscribe
- Mute
- Subscribe to RSS Feed
- Permalink
- Report Inappropriate Content
Good looking report.
How did you change the background color on slides 2-9 from white to gray? The gray background looks great with white widgets/charts on top.
Thanks,
Mike