- Power BI forums
- Updates
- News & Announcements
- Get Help with Power BI
- Desktop
- Service
- Report Server
- Power Query
- Mobile Apps
- Developer
- DAX Commands and Tips
- Custom Visuals Development Discussion
- Health and Life Sciences
- Power BI Spanish forums
- Translated Spanish Desktop
- Power Platform Integration - Better Together!
- Power Platform Integrations (Read-only)
- Power Platform and Dynamics 365 Integrations (Read-only)
- Training and Consulting
- Instructor Led Training
- Dashboard in a Day for Women, by Women
- Galleries
- Community Connections & How-To Videos
- COVID-19 Data Stories Gallery
- Themes Gallery
- Data Stories Gallery
- R Script Showcase
- Webinars and Video Gallery
- Quick Measures Gallery
- 2021 MSBizAppsSummit Gallery
- 2020 MSBizAppsSummit Gallery
- 2019 MSBizAppsSummit Gallery
- Events
- Ideas
- Custom Visuals Ideas
- Issues
- Issues
- Events
- Upcoming Events
- Community Blog
- Power BI Community Blog
- Custom Visuals Community Blog
- Community Support
- Community Accounts & Registration
- Using the Community
- Community Feedback
Register now to learn Fabric in free live sessions led by the best Microsoft experts. From Apr 16 to May 9, in English and Spanish.
- Power BI forums
- Galleries
- Data Stories Gallery
- North Korea - "Handle with Care"
North Korea - "Handle with Care"
01-24-2018 20:55 PM - last edited 11-26-2018 17:56 PM


- Mark as New
- Bookmark
- Subscribe
- Mute
- Subscribe to RSS Feed
- Permalink
- Report Inappropriate Content
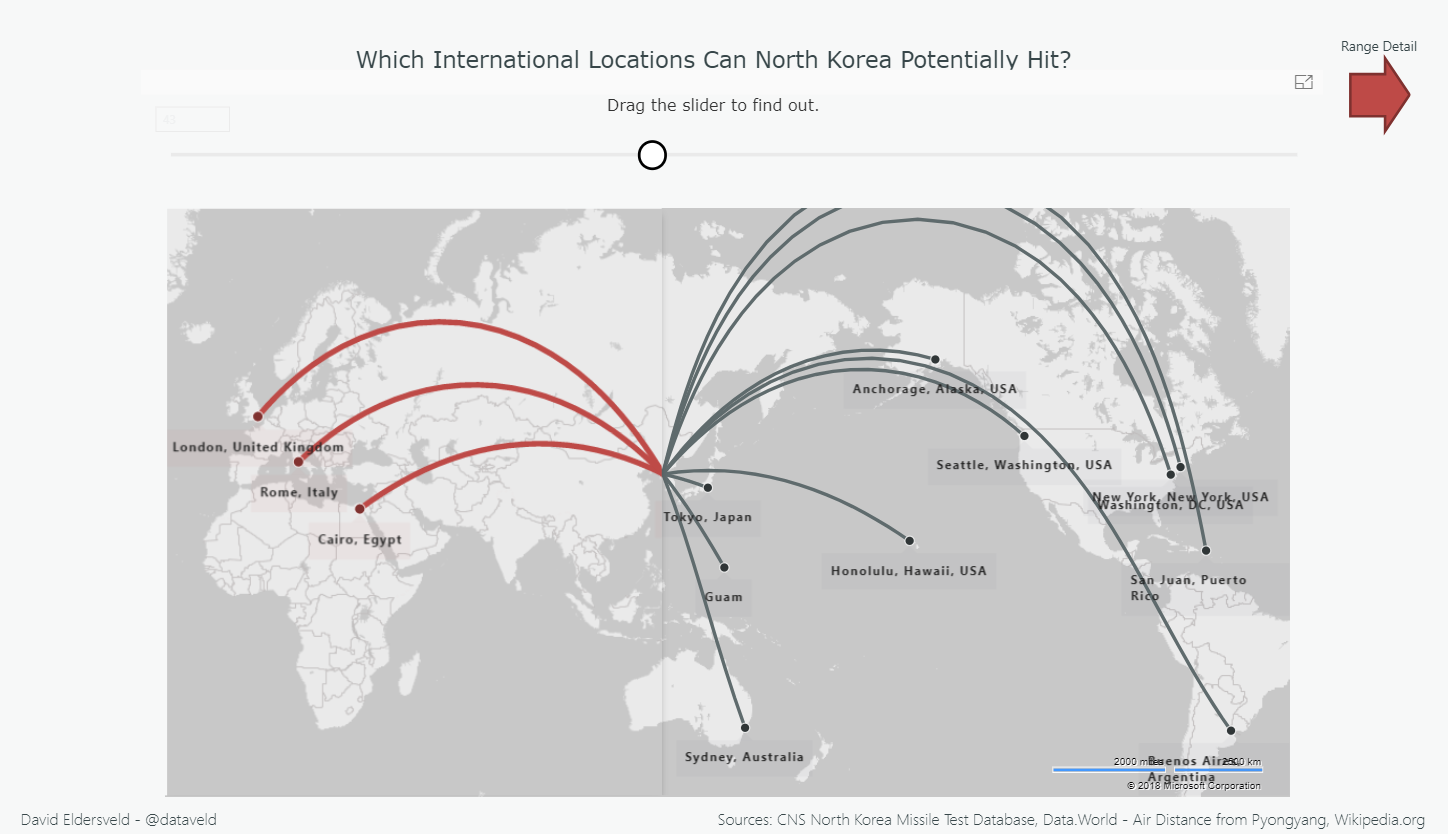
North Korea - "Handle with Care"
I was interested in this topic after seeing data surrounding North Korea's progress in missile technology. The country also launched two missiles over Japan in 2017 and was in the news a lot. While the country first tested a nuclear device over a decade ago, it now has the capability to launch missiles much further than it could at the end of 2016. View the report to see how far each missile can reach as well as some potential cities around the globe that could be in range.
A few notes:
1) The color selection is meant to evoke a military feel.
2) I used DAX to calculate the sample trajectories of test launches and displayed them using the line chart. By including a reference to the where the ISS orbits, viewers can see how high certain missiles travel (much higher than I expected).
3) The image sliding over the map makes use of the What-If parameter, HTML Viewer custom visual, and the Flow Map custom visual. I wanted to see if it was possible to build a before/after image comparison without having to build a brand new custom visual. This help show the flexibility of the HTML Viewer.
4) Bookmarks are used to navigate using a consistent arrow in the top right corner.
Data came from a few different sources (also listed with direct URLs on the last report page):
1) Missile launch data was obtained from the CNS North Korea Missile Test Database, a collection of statistics about North Korea's missile tests (launch date, missile name, missile type, distance, apogee, etc.). Available via the Nuclear Threat Initiative (NTI). The PBIX directs to the web version of the CNS North Korea Missile Test Database rather than a local file.
2) Air distances from Pyongyang to various international locations were compiled from https://www.distancefromto.net/ using latitude and longitude, and the resulting data was posted as a dataset to Data.World. The PBIX pulls the data from Data.World as a result.
3) Various statistics about the Hwasong missile types were obtained from Wikipedia (max estimated range in particular).
4) One local Excel "helper" source file facilitates the image over map slider (ImageComparison.xlsx available here: https://github.com/deldersveld/pbiImageSlider/blob/master/ImageComparison.xlsx).
eyJrIjoiN2Q4YWMzZTYtOTA0Ni00MjIzLTlhNTgtMjE0OTQwY2U1MjA5IiwidCI6ImFjYzhhYWE1LWYxOTEtNDgyZi05MjFiLWNmNmMzM2E1ODgzMiIsImMiOjF9
- Mark as New
- Bookmark
- Subscribe
- Mute
- Subscribe to RSS Feed
- Permalink
- Report Inappropriate Content
Good and interesting post, thanks. I guess there are very few things we know about North Korea, it is very closed and specific country, welcomes zero tourists and restricts it's citizens from visiting other countries, too. Everything I know about NK I owe to travel books and some documentaries, and of course I would like to know more.
- Mark as New
- Bookmark
- Subscribe
- Mute
- Subscribe to RSS Feed
- Permalink
- Report Inappropriate Content
Awesome data storytelling!
And great use of DAX/PowerBI visuals' features!
Well done!