- Power BI forums
- Updates
- News & Announcements
- Get Help with Power BI
- Desktop
- Service
- Report Server
- Power Query
- Mobile Apps
- Developer
- DAX Commands and Tips
- Custom Visuals Development Discussion
- Health and Life Sciences
- Power BI Spanish forums
- Translated Spanish Desktop
- Power Platform Integration - Better Together!
- Power Platform Integrations (Read-only)
- Power Platform and Dynamics 365 Integrations (Read-only)
- Training and Consulting
- Instructor Led Training
- Dashboard in a Day for Women, by Women
- Galleries
- Community Connections & How-To Videos
- COVID-19 Data Stories Gallery
- Themes Gallery
- Data Stories Gallery
- R Script Showcase
- Webinars and Video Gallery
- Quick Measures Gallery
- 2021 MSBizAppsSummit Gallery
- 2020 MSBizAppsSummit Gallery
- 2019 MSBizAppsSummit Gallery
- Events
- Ideas
- Custom Visuals Ideas
- Issues
- Issues
- Events
- Upcoming Events
- Community Blog
- Power BI Community Blog
- Custom Visuals Community Blog
- Community Support
- Community Accounts & Registration
- Using the Community
- Community Feedback
Register now to learn Fabric in free live sessions led by the best Microsoft experts. From Apr 16 to May 9, in English and Spanish.
- Power BI forums
- Galleries
- Data Stories Gallery
- MLB Baseball Batting Statistics
MLB Baseball Batting Statistics
11-14-2018 11:53 AM - last edited 03-20-2023 14:51 PM


- Mark as New
- Bookmark
- Subscribe
- Mute
- Subscribe to RSS Feed
- Permalink
- Report Inappropriate Content
MLB Baseball Batting Statistics
An overview of the pages: (update 2015 to 2022)
Cover Page:
This page uses wallpaper as well as buttons and is the home page of report. The other pages are all hidden, so the user will use the menu to navigate the report. The buttons use actions and bookmarks to act as the menu.
Top 10 Batting Categories:
This page allows users to see the Top 10 Players in various batting categories. The data can be sliced by season and position. Also this page uses Chiclet Slicer visualization from the marketplace. This provides a visual slicer using league and team logos to slice data.
Since there are too many batting categories to easily fit on one page, there are shape objects acting as "radio buttons" at the top of the page to allow a user to move from Page 1 to Page 2. These shape objects use actions, bookmarks and selection pane to control which visualizations show on the screen.
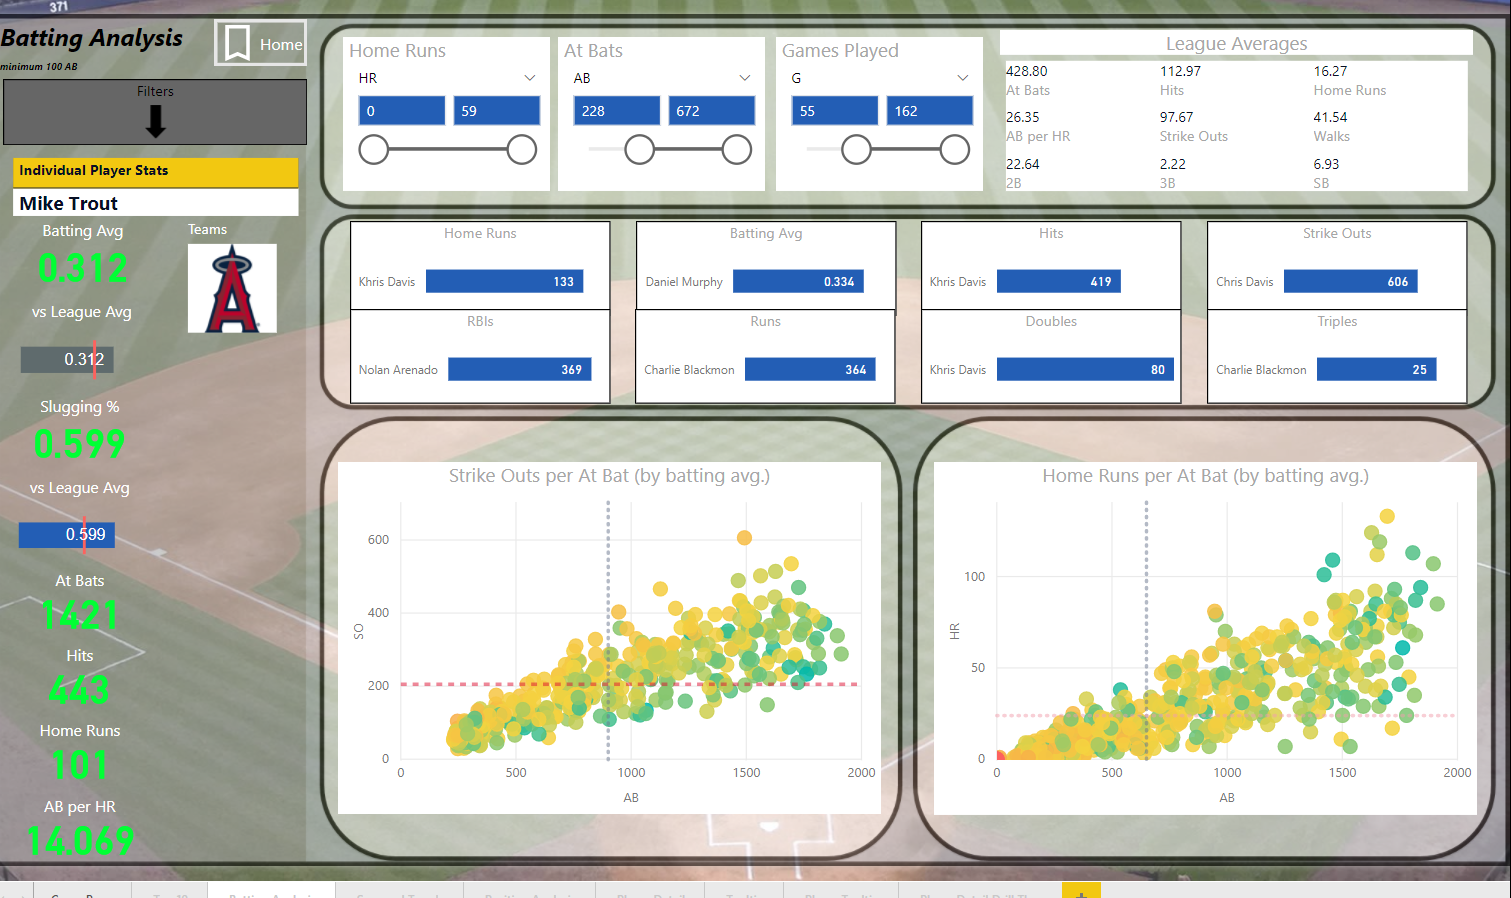
Batting Analysis:
This page has two components. On the right side of the screen, users can see league averages as well as leaders in various categories and an analysis homes runs and strike outs per at bat. On the left side there are slicers along with the selection of one player. The player name slice does not interact with the right side of the screen. This allows the user to compare one players statistics to the league leaders and league averages. The player stats are shown using the Advance Card visualization from the marketplace that allows for conditional formatting.
There are a couple custom tooltips used on this page including on the individual player name and the Strike Outs per At Bat and Home Runs per At Bat visuals.
This page also uses a page background to provide some outlines and shading around the visualizations.
Seasonal Trends:
This page looks at the three years of data across major batting categories. Again the page uses the Chiclet Slicer to select the team as a filter.
Position Analysis:
This page gives two different views of the batting categories with the ability to slice by season, position and team. The initial (graphical) view of the data uses Box and Whisker charts to show the high, low and medians of the data. The secondary (detail) view provides a table view of the data with conditional formatting. The views are switched by buttons on the left side using buttons, actions, bookmarks and selection pane.
Player Details:
Player details provides the standard table view of the data with the ability to select by season and team.
Drill Throughs:
There is a drill through setup on the player name field, so users can select to drill through on any player name in a visual to see more detail statistics.
This is just a sample of what can be done with Power BI and baseball statistics. The data model also includes data by team, but I have not had a chance to play with it yet. Feel free to download the file and build out your own reports.
eyJrIjoiZDdhMTQ1Y2MtZmVkZC00ZGE1LWI3MGMtNjAxNGY1NzQ0NWNlIiwidCI6ImJiOWNlYmY0LTdmY2YtNGFiOC05Njg5LTQxNWZlMzY4NGYwZCIsImMiOjN9&pageName=ReportSection62db92a735f96b9442cb
- Mark as New
- Bookmark
- Subscribe
- Mute
- Subscribe to RSS Feed
- Permalink
- Report Inappropriate Content
hi man, I loved your report, it helped me a lot in one of my own that I just finished, I intended to provide a comparison of the Red Sox champions in the century, I would like you to see it and give me your opinions, thanks in advance.
- Mark as New
- Bookmark
- Subscribe
- Mute
- Subscribe to RSS Feed
- Permalink
- Report Inappropriate Content
That's excellent report. I like it.
A question, How can I modified to update all season that have MLB? I mean, 2016 to 2023
Please.
Thanks.
- Mark as New
- Bookmark
- Subscribe
- Mute
- Subscribe to RSS Feed
- Permalink
- Report Inappropriate Content
Thanks for your comment - I have gone through the report and updated it through 2022. I am using stats from Baseball Reference, so they do not have anything on 2023 until the season starts.
- Mark as New
- Bookmark
- Subscribe
- Mute
- Subscribe to RSS Feed
- Permalink
- Report Inappropriate Content
I got it. Good.
- Mark as New
- Bookmark
- Subscribe
- Mute
- Subscribe to RSS Feed
- Permalink
- Report Inappropriate Content
Sweet report! Do you know of any way to get data on where balls were hit? It would be awesome to create a dynamic spray chart!
Good work @dsecpa
- Mark as New
- Bookmark
- Subscribe
- Mute
- Subscribe to RSS Feed
- Permalink
- Report Inappropriate Content
That would be a great report, but it would certainly take a lot of data. It appears there might be some data available at www.retrosheet.org, for every play and it looks like it has information about were the hit went. Might be an interesting project, but I would expect it would take some time to manipulate the data.