Environment Agency Water level readings
06-17-2017 03:16 AM


3990 Views




- Mark as New
- Bookmark
- Subscribe
- Mute
- Subscribe to RSS Feed
- Permalink
- Report Inappropriate Content
Environment Agency Water level readings
06-17-2017
03:16 AM
The Environment Agency is a Government organisation in the UK responsible for environmental matters. They provide open data available to the public on flood and river levels - and provide this data as CSV archives and from their API:http://environment.data.gov.uk/flood-monitoring/archive.
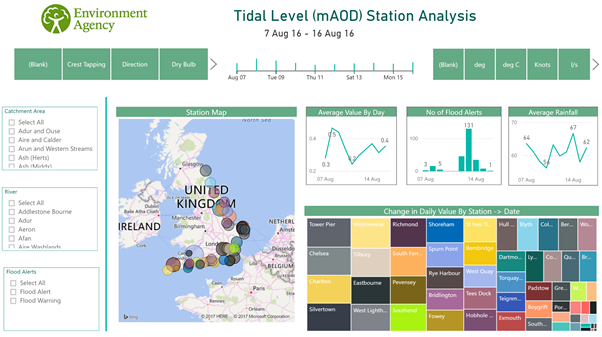
This report uses the CSV archives (the Number of days to bring in data for is defined as a parameter in Query Editor) to show river level readings at various stations across the UK.
The data for each station is updated every 15 mins or so which means there is a large volume of data! For this reason, a daily summary table (containing the min/max reading value for each day) is dynamically created using a calculated table.
This report also makes use of dynamic measures/titles (Using a parameter table) and features a number of custom visuals.