- Power BI forums
- Updates
- News & Announcements
- Get Help with Power BI
- Desktop
- Service
- Report Server
- Power Query
- Mobile Apps
- Developer
- DAX Commands and Tips
- Custom Visuals Development Discussion
- Health and Life Sciences
- Power BI Spanish forums
- Translated Spanish Desktop
- Power Platform Integration - Better Together!
- Power Platform Integrations (Read-only)
- Power Platform and Dynamics 365 Integrations (Read-only)
- Training and Consulting
- Instructor Led Training
- Dashboard in a Day for Women, by Women
- Galleries
- Community Connections & How-To Videos
- COVID-19 Data Stories Gallery
- Themes Gallery
- Data Stories Gallery
- R Script Showcase
- Webinars and Video Gallery
- Quick Measures Gallery
- 2021 MSBizAppsSummit Gallery
- 2020 MSBizAppsSummit Gallery
- 2019 MSBizAppsSummit Gallery
- Events
- Ideas
- Custom Visuals Ideas
- Issues
- Issues
- Events
- Upcoming Events
- Community Blog
- Power BI Community Blog
- Custom Visuals Community Blog
- Community Support
- Community Accounts & Registration
- Using the Community
- Community Feedback
Register now to learn Fabric in free live sessions led by the best Microsoft experts. From Apr 16 to May 9, in English and Spanish.
- Power BI forums
- Galleries
- Data Stories Gallery
- Re: Create Dynamic Periods for Fiscal or Calendar ...
Re: Create Dynamic Periods for Fiscal or Calendar Dates and Dynamic Month Names for Charts
07-11-2017 20:03 PM


- Mark as New
- Bookmark
- Subscribe
- Mute
- Subscribe to RSS Feed
- Permalink
- Report Inappropriate Content
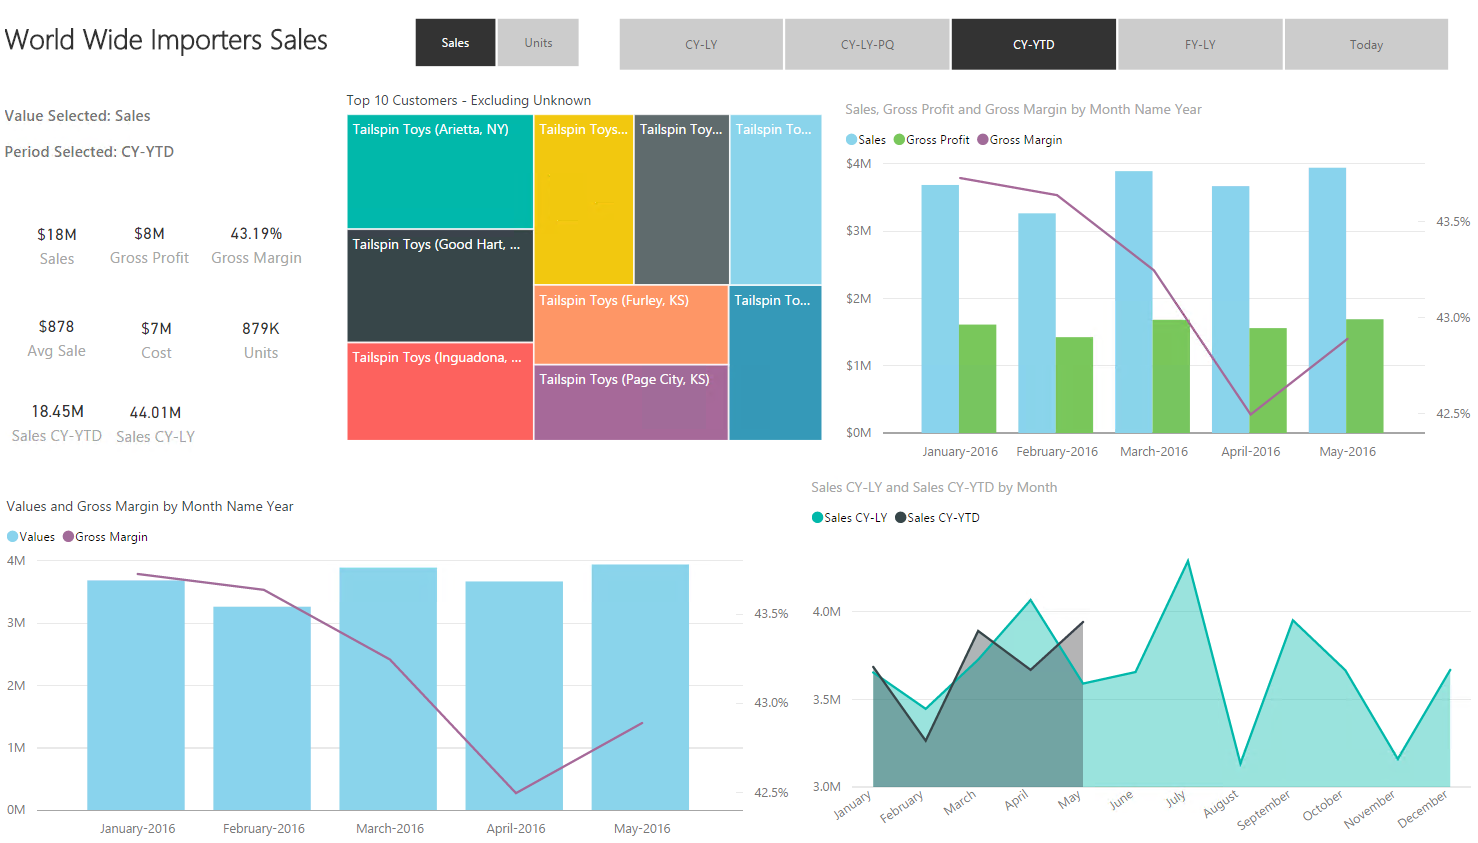
Create Dynamic Periods for Fiscal or Calendar Dates and Dynamic Month Names for Charts
For this data story, my first goal was to be able to create any Date Period that was required for the data. As with the example we have creaated a few simple Periods "CY-LY" (Calendar Year - Last Year), "CY-YTD" (Calendar Year - Year to Date). And in doing so, it gives the user the ability quickly slice their data by the defined period.
Second to this I also created a solution in which the Month Names would dynamically change to either the Fiscal Months (If a Fiscal Period was selected) or Calendar Months (If a Caleandar Period was selected).
So in the report if you click on "CY-YTD", you will see that the dates follow "Jan-May"
Whilst if you click on "FY-LY", you will see that the dates follow the Fiscal Periods "Nov - October"
The final part of the data story is that using the Periods, it makes it very easy to create Calculated Measures based on your custom periods. And his is a lot easier and quicker when your custom periods do not have built in DAX functions.
In doing so that this does is it enables the user to have the ability to quickly and easily slice their data based on custom periods.
I have also published a blog post in terms of how I achieved this.
Create Dynamic Periods for Fiscal or Calendar Dates in Power BI
eyJrIjoiZGNjNGUzM2ItZWVhOS00ZWRlLWFlZmEtZjljMDZlMmNmMTY0IiwidCI6ImQ3MGI0ZDU1LWE1OTItNDVmMi05OWYzLTI5OWFlNWVlN2FkZSJ9
- Mark as New
- Bookmark
- Subscribe
- Mute
- Subscribe to RSS Feed
- Permalink
- Report Inappropriate Content
- Mark as New
- Bookmark
- Subscribe
- Mute
- Subscribe to RSS Feed
- Permalink
- Report Inappropriate Content
Hi @amirsheva
If you click on the blog post, and then go to the end you will see the option to download the PBIX
- Mark as New
- Bookmark
- Subscribe
- Mute
- Subscribe to RSS Feed
- Permalink
- Report Inappropriate Content
Do you offer Power BI classes?
- Mark as New
- Bookmark
- Subscribe
- Mute
- Subscribe to RSS Feed
- Permalink
- Report Inappropriate Content
- Mark as New
- Bookmark
- Subscribe
- Mute
- Subscribe to RSS Feed
- Permalink
- Report Inappropriate Content
Very good dashboard and financial calender is what a lot of companies use.
What did you use to publish this dashboard into a webpage.
I am new to this environment.
regards
willy
- Mark as New
- Bookmark
- Subscribe
- Mute
- Subscribe to RSS Feed
- Permalink
- Report Inappropriate Content
I am glad you found it useful. I do also have a blog post and pbix file explaining how I achieved this.
The feature is called publish to web after you upload your Power BI desktop file to the Power BI service. You can then click on file and then Publish to Web.
Just note that when you publish to web it is available for anyone who has access to the link.
- Mark as New
- Bookmark
- Subscribe
- Mute
- Subscribe to RSS Feed
- Permalink
- Report Inappropriate Content
let

TodaysDate = Date.From(DateTimeZone.FixedUtcNow()),

YearText = Number.ToText(2000),

FiscalStartMonth = Date.Month(Date.FromText(“”&YearText&”-“&#”Fiscal Start Month”&“”)),

FiscalStartMonthDay = Date.Day(Date.StartOfMonth(Date.FromText(“”&YearText&”-“&#”Fiscal Start Month”&“”))),

FiscalEndMonth = Date.Month(Date.FromText(“”&YearText&”-“&#”Fiscal End Month”&“”)),

FiscalEndMonthDay = Date.Day(Date.EndOfMonth(Date.FromText(“”&YearText&”-“&#”Fiscal End Month”&“”))),
where did he edit this, =_= I don't know where I couldn't replicate the example =_=
- Mark as New
- Bookmark
- Subscribe
- Mute
- Subscribe to RSS Feed
- Permalink
- Report Inappropriate Content
- Mark as New
- Bookmark
- Subscribe
- Mute
- Subscribe to RSS Feed
- Permalink
- Report Inappropriate Content
- Mark as New
- Bookmark
- Subscribe
- Mute
- Subscribe to RSS Feed
- Permalink
- Report Inappropriate Content
- Mark as New
- Bookmark
- Subscribe
- Mute
- Subscribe to RSS Feed
- Permalink
- Report Inappropriate Content
Very nice report. Thanks for the blog post too. May I ask what's the KPI like visual u use on page 3? Where can I find it?
- Mark as New
- Bookmark
- Subscribe
- Mute
- Subscribe to RSS Feed
- Permalink
- Report Inappropriate Content
Hi there
Thanks for the kind words. And the visual on page 3 was done by a 3rd party developer.
You can contact him on contact@dax365.com his name is Nick Savenko
- Mark as New
- Bookmark
- Subscribe
- Mute
- Subscribe to RSS Feed
- Permalink
- Report Inappropriate Content
thank you for the information.
- Mark as New
- Bookmark
- Subscribe
- Mute
- Subscribe to RSS Feed
- Permalink
- Report Inappropriate Content
- Mark as New
- Bookmark
- Subscribe
- Mute
- Subscribe to RSS Feed
- Permalink
- Report Inappropriate Content
Nice Dashboard, really like the feature which allows to select the unit of measure and the different date periods. By the way, on Page 4 there is a breakdown tree. Is it possible to share the visualization, I was searched for this since Performance Point.