- Power BI forums
- Updates
- News & Announcements
- Get Help with Power BI
- Desktop
- Service
- Report Server
- Power Query
- Mobile Apps
- Developer
- DAX Commands and Tips
- Custom Visuals Development Discussion
- Health and Life Sciences
- Power BI Spanish forums
- Translated Spanish Desktop
- Power Platform Integration - Better Together!
- Power Platform Integrations (Read-only)
- Power Platform and Dynamics 365 Integrations (Read-only)
- Training and Consulting
- Instructor Led Training
- Dashboard in a Day for Women, by Women
- Galleries
- Community Connections & How-To Videos
- COVID-19 Data Stories Gallery
- Themes Gallery
- Data Stories Gallery
- R Script Showcase
- Webinars and Video Gallery
- Quick Measures Gallery
- 2021 MSBizAppsSummit Gallery
- 2020 MSBizAppsSummit Gallery
- 2019 MSBizAppsSummit Gallery
- Events
- Ideas
- Custom Visuals Ideas
- Issues
- Issues
- Events
- Upcoming Events
- Community Blog
- Power BI Community Blog
- Custom Visuals Community Blog
- Community Support
- Community Accounts & Registration
- Using the Community
- Community Feedback
Register now to learn Fabric in free live sessions led by the best Microsoft experts. From Apr 16 to May 9, in English and Spanish.
- Power BI forums
- Galleries
- Data Stories Gallery
- Re: AdventureWorks Sales Dashboard - 2023 Edition
Re: AdventureWorks Sales Dashboard - 2023 Edition
03-02-2023 23:37 PM - last edited 03-02-2023 23:38 PM


- Mark as New
- Bookmark
- Subscribe
- Mute
- Subscribe to RSS Feed
- Permalink
- Report Inappropriate Content
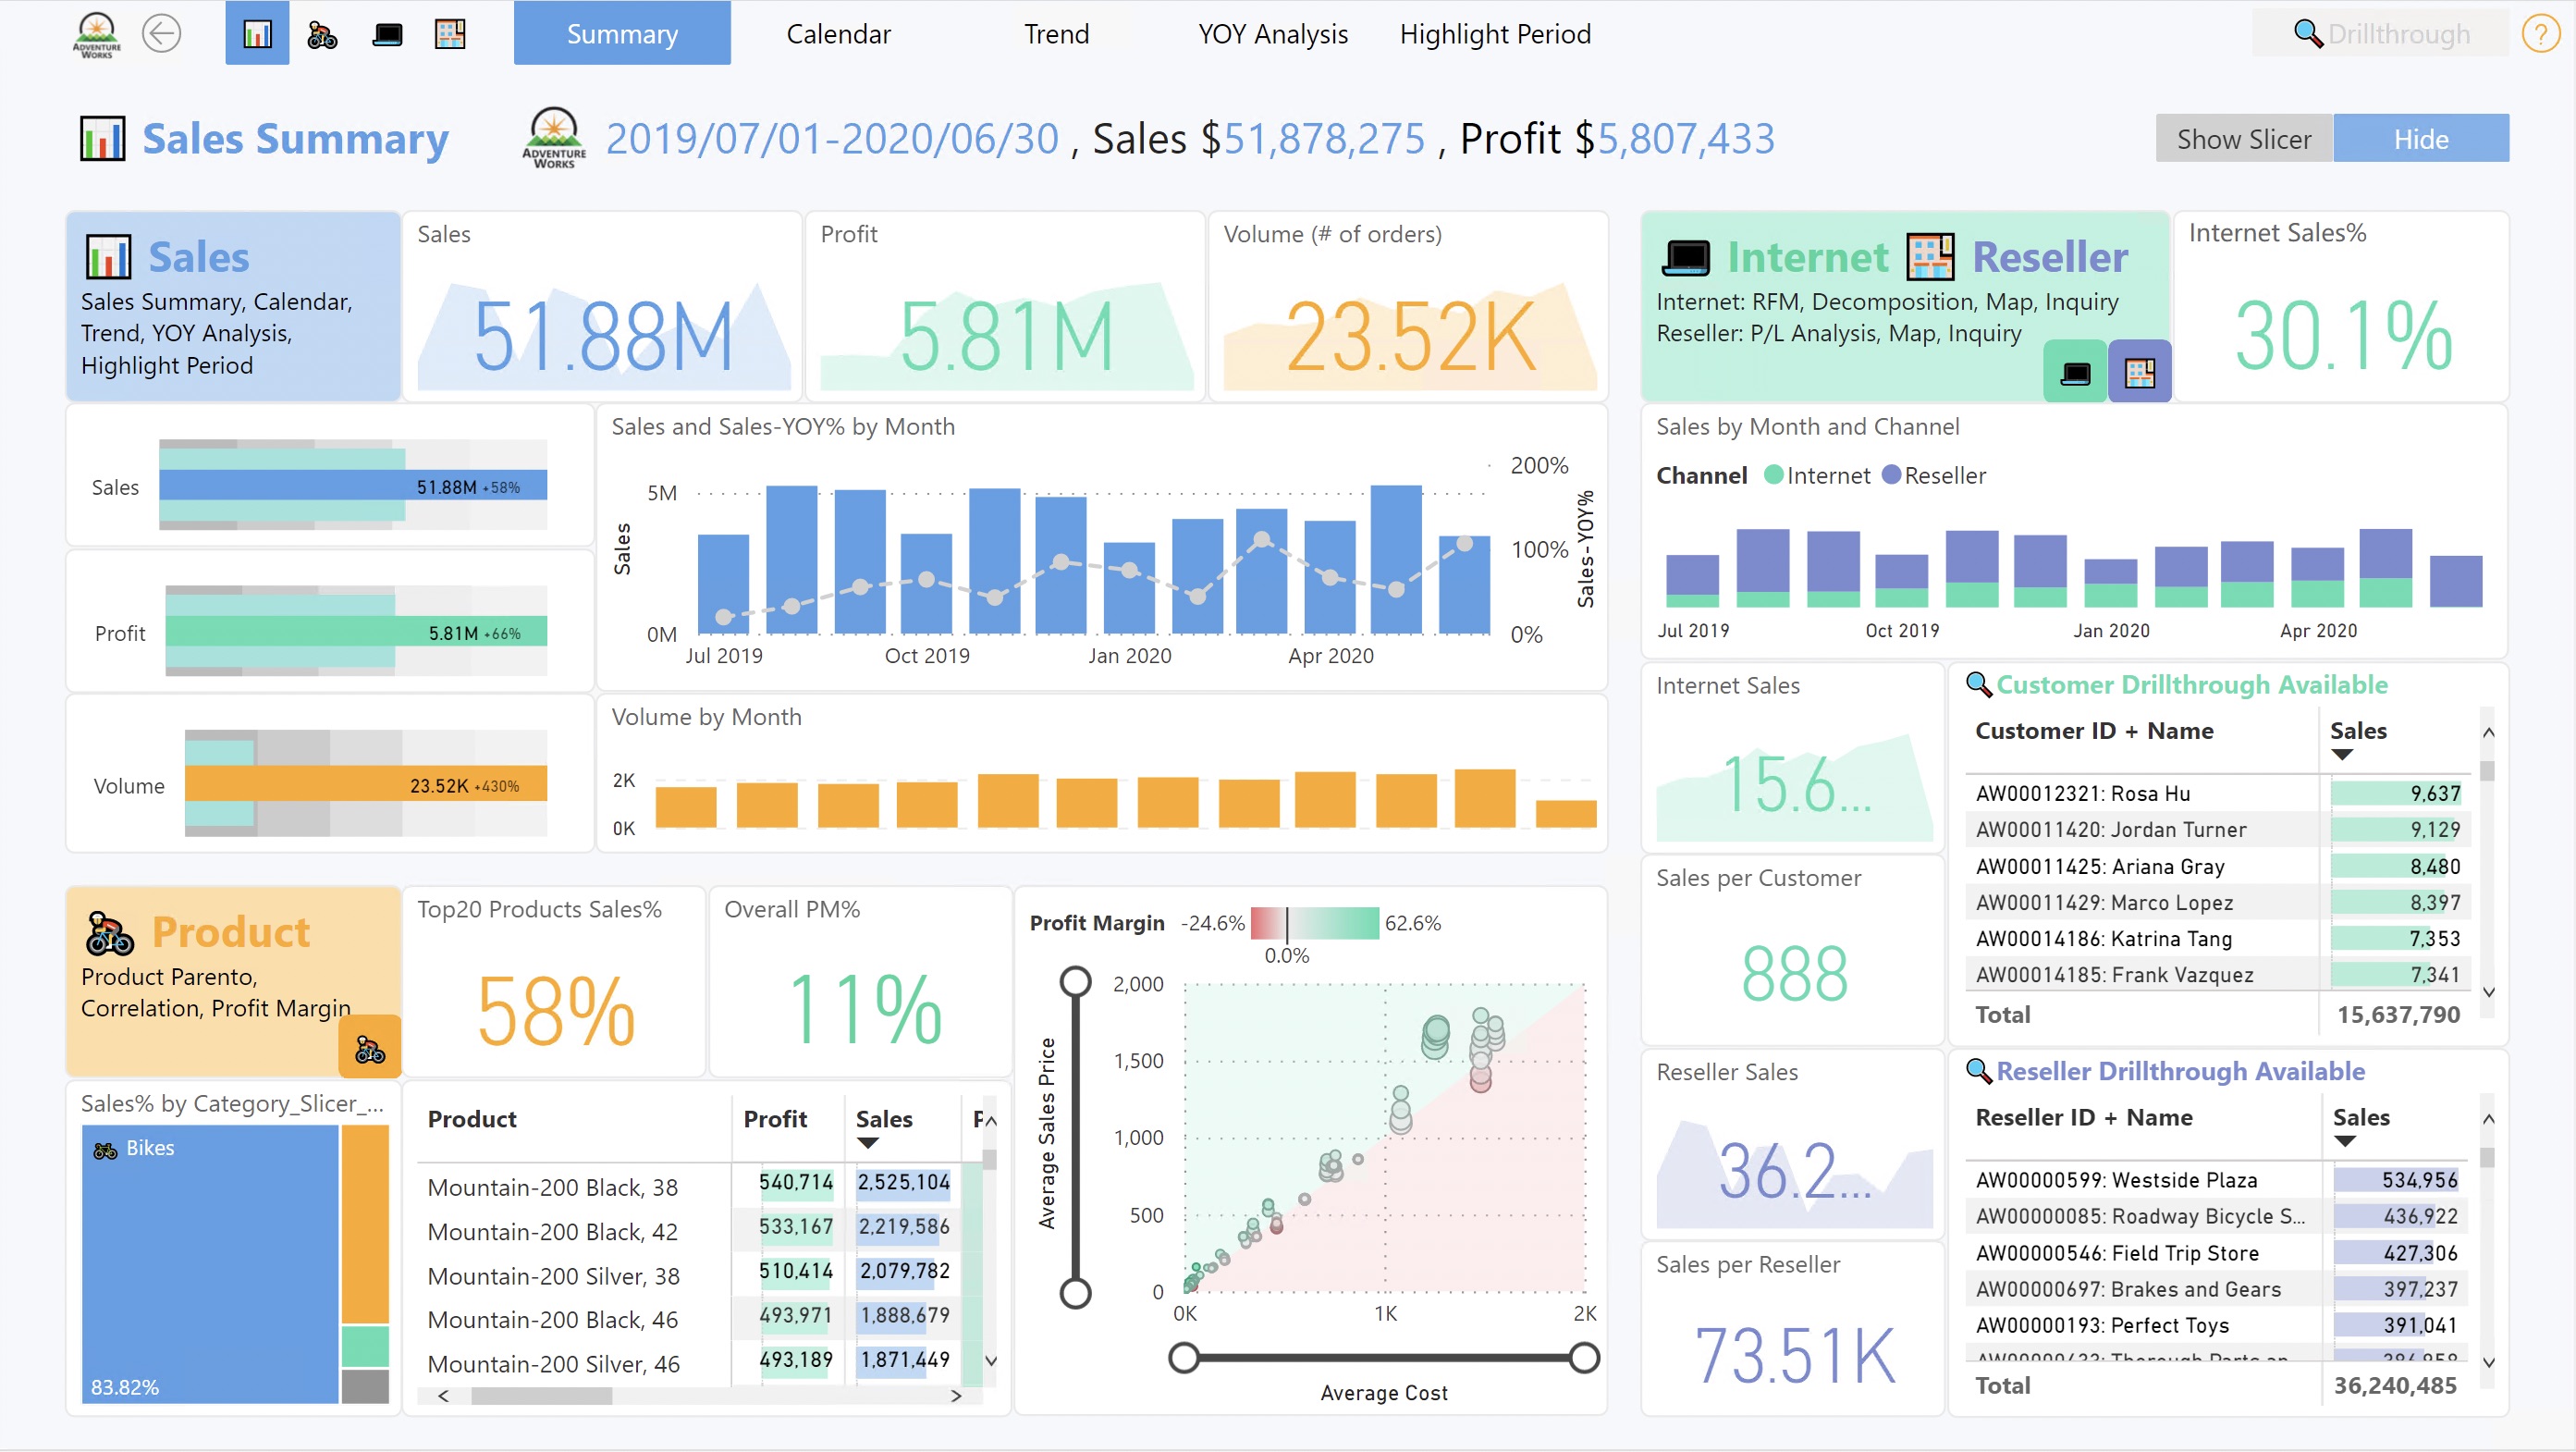
AdventureWorks Sales Dashboard - 2023 Edition
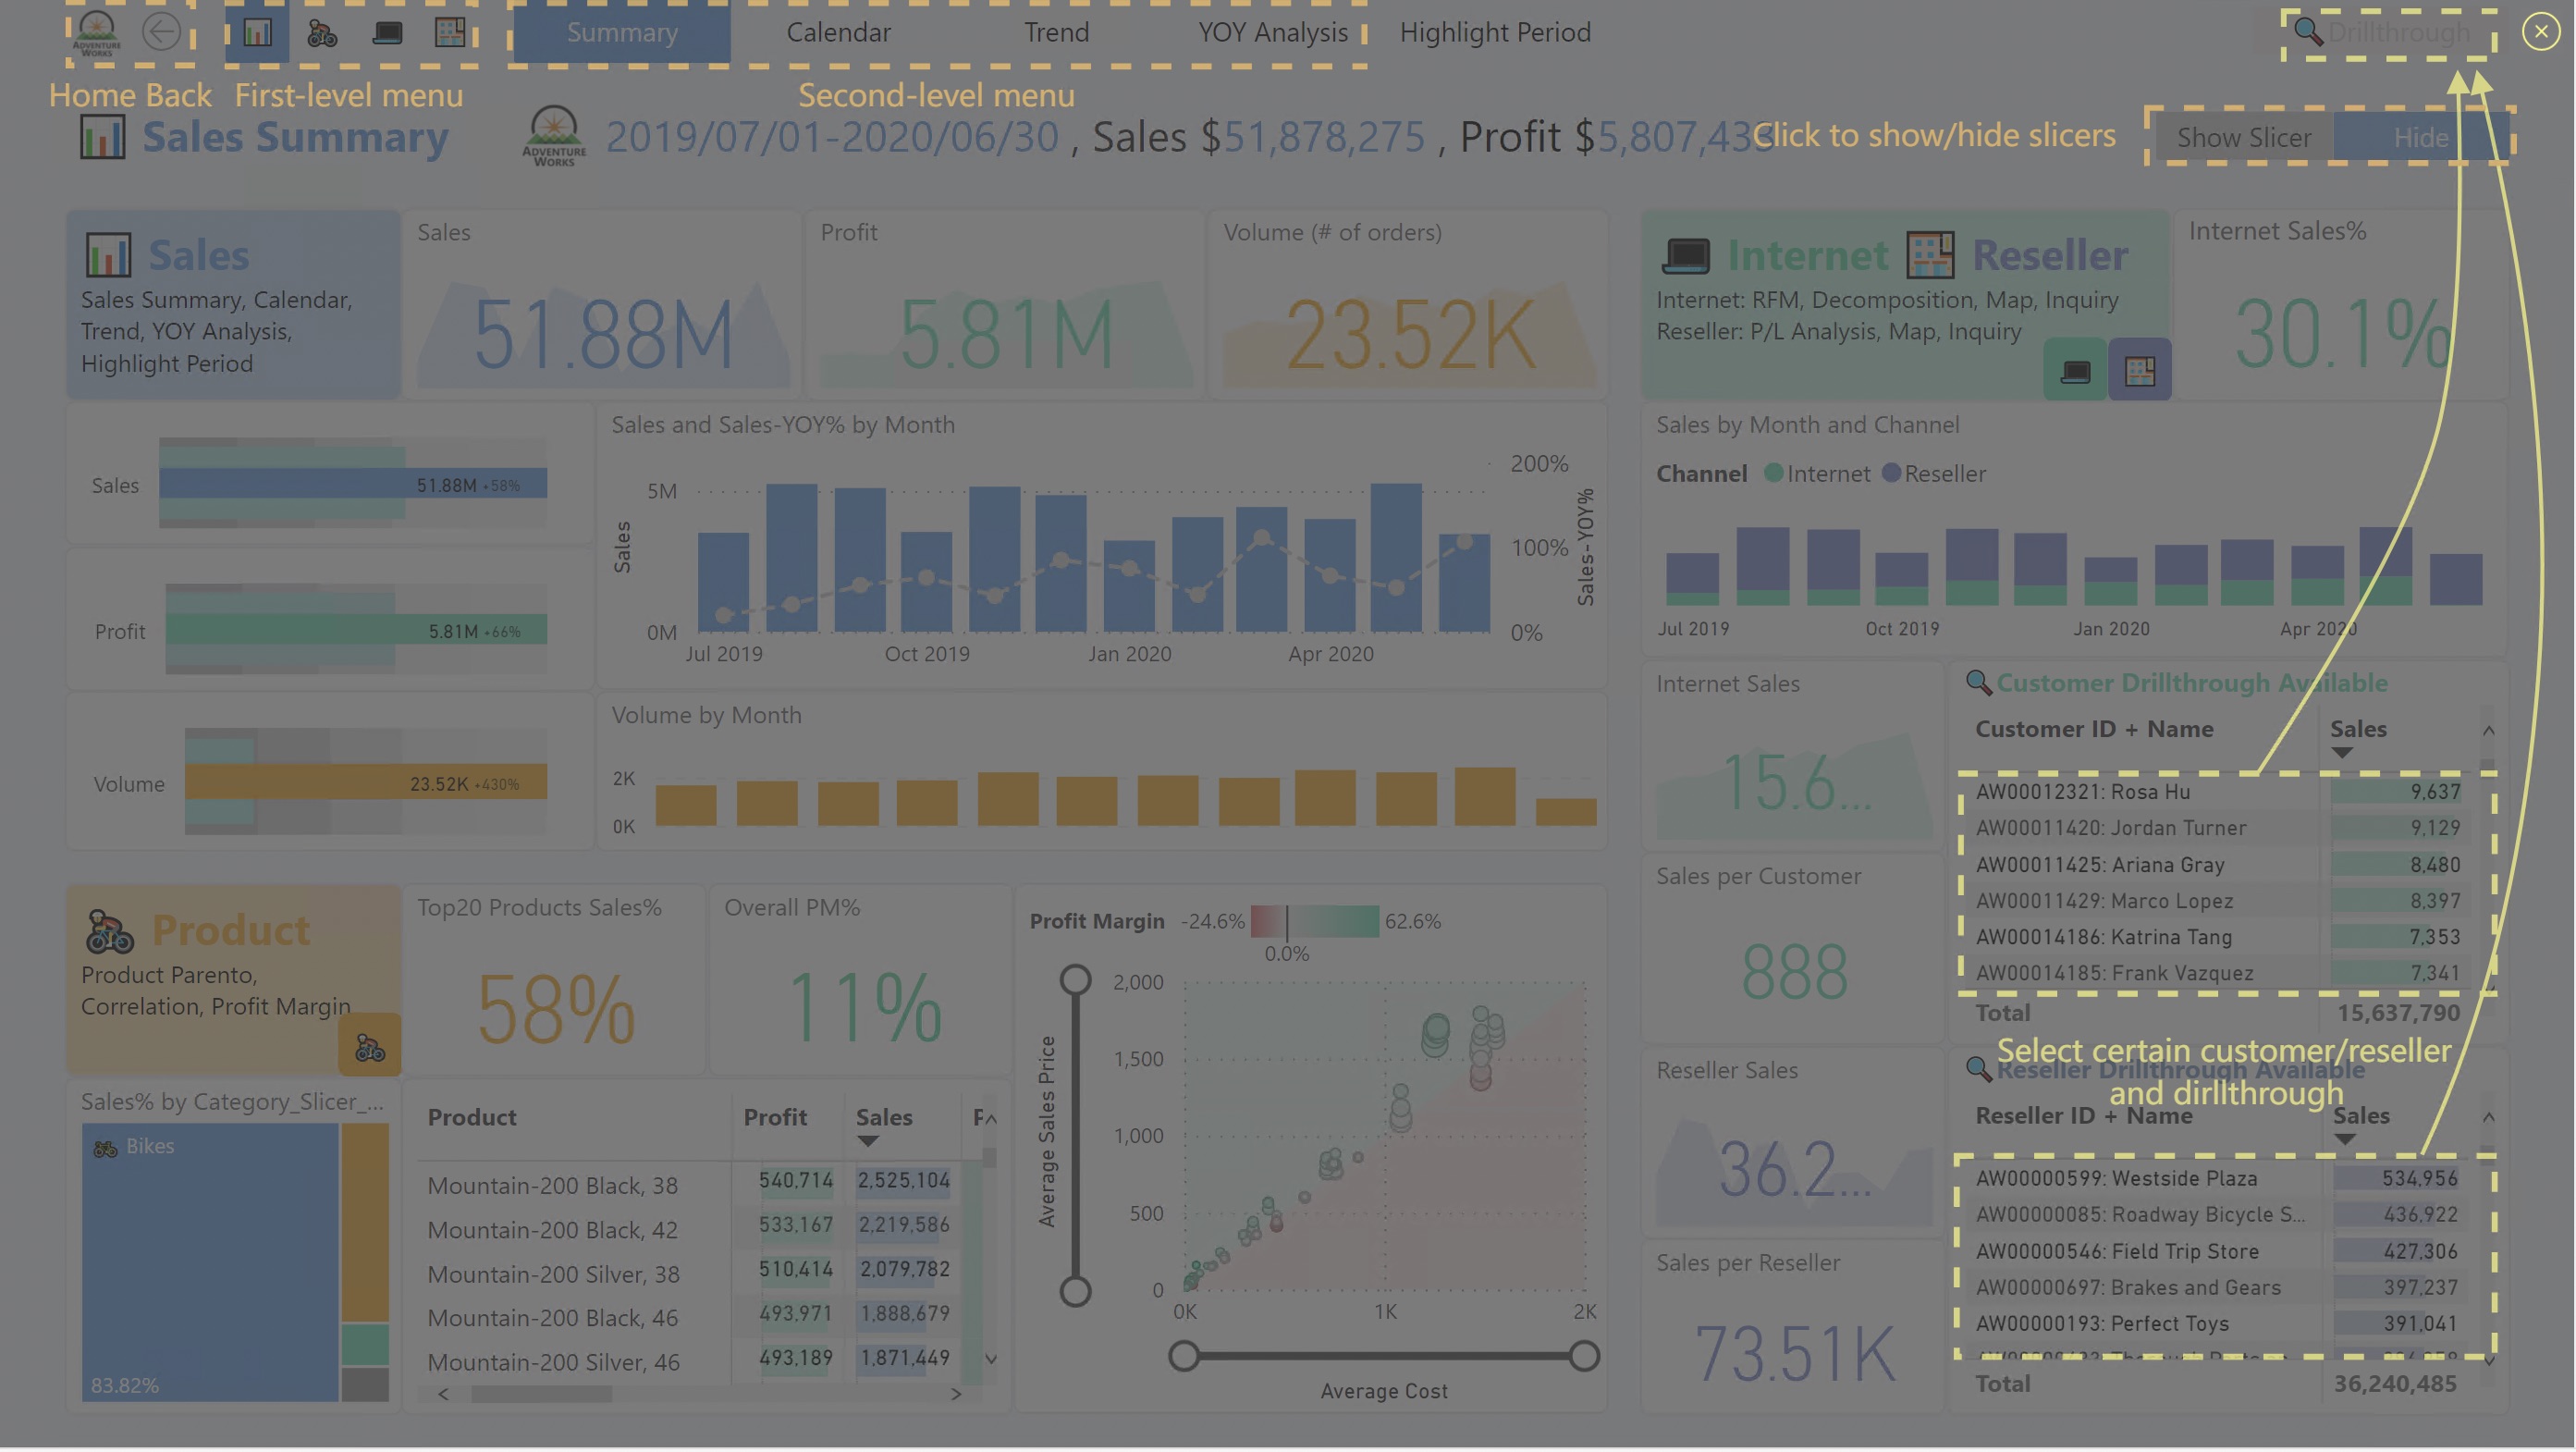
- When users select one single customer/reseller, they actually want to know more details about this customer/reseller. This is a very natural data demand.
- My solution is that when a customer/reseller is selected, the drill-through button in the upper right corner will be activated, and it can jump to an independent customer/reseller details page. The details page can include basic information, sales, order volume, profit, and other indicators.
- After browsing the detail page, users can return to the previous page through the yellow back button in the upper left corner.
eyJrIjoiYWJkZGYyMTctZTBhMC00M2RlLTllNTQtOWE3MDJjNjZlMGQ3IiwidCI6ImVlNjZhNWNkLTY0MWQtNDA2Ny1hMTMyLTEzNzY2NGExN2ZlMSIsImMiOjEwfQ%3D%3D
- Mark as New
- Bookmark
- Subscribe
- Mute
- Subscribe to RSS Feed
- Permalink
- Report Inappropriate Content
I haven’t counted time specifically, I made this demo by integrating pages from multiple projects. If I start from scratch, I feel it would take several weeks.
- Mark as New
- Bookmark
- Subscribe
- Mute
- Subscribe to RSS Feed
- Permalink
- Report Inappropriate Content
Can you please share .pbix at ziyin.wu@beiersdorf.com
- Mark as New
- Bookmark
- Subscribe
- Mute
- Subscribe to RSS Feed
- Permalink
- Report Inappropriate Content
Hello, I am sorry that I decide not to share the complete .pbix file at this moment. I am considering make a series of tutorial videos on youtube. Is it an interesting idea?
- Mark as New
- Bookmark
- Subscribe
- Mute
- Subscribe to RSS Feed
- Permalink
- Report Inappropriate Content
Hello, Can you please share your youtube channel link on sjmfamilydesk@gmail.com
- Mark as New
- Bookmark
- Subscribe
- Mute
- Subscribe to RSS Feed
- Permalink
- Report Inappropriate Content
Yes, of course!! Very interesting! Tell me more about it 🙂
- Mark as New
- Bookmark
- Subscribe
- Mute
- Subscribe to RSS Feed
- Permalink
- Report Inappropriate Content
Fantastic dashboard!! Can you please share .pbix at: anaisabel.cabrerafernandez@gmail.com
- Mark as New
- Bookmark
- Subscribe
- Mute
- Subscribe to RSS Feed
- Permalink
- Report Inappropriate Content
Can you please share .pbix at apoorva.kapoor03@gmail.com
- Mark as New
- Bookmark
- Subscribe
- Mute
- Subscribe to RSS Feed
- Permalink
- Report Inappropriate Content
Great work here! I like how you provide other metrics.
Would you be able to share your pbix file?
- Mark as New
- Bookmark
- Subscribe
- Mute
- Subscribe to RSS Feed
- Permalink
- Report Inappropriate Content
This is a phenomenal piece of work. Although there is no single page that is a "center-piece" mindblowing experience, as a suite of dashboards this is without doubt one of the best example dashboards. Well done, this should be the Gold Standard in Dashboard design.
- Mark as New
- Bookmark
- Subscribe
- Mute
- Subscribe to RSS Feed
- Permalink
- Report Inappropriate Content
Thanks. Your feedback means a lot to me.
- Mark as New
- Bookmark
- Subscribe
- Mute
- Subscribe to RSS Feed
- Permalink
- Report Inappropriate Content
Good work! The dashboard is fantastic