New Offer! Become a Certified Fabric Data Engineer
Check your eligibility for this 50% exam voucher offer and join us for free live learning sessions to get prepared for Exam DP-700.
Get StartedDon't miss out! 2025 Microsoft Fabric Community Conference, March 31 - April 2, Las Vegas, Nevada. Use code MSCUST for a $150 discount. Prices go up February 11th. Register now.
- Data Factory forums
- Forums
- Get Help with Data Factory
- Data Pipeline
- Re: Unable to open Pipeline: Failed to load resour...
- Subscribe to RSS Feed
- Mark Topic as New
- Mark Topic as Read
- Float this Topic for Current User
- Bookmark
- Subscribe
- Printer Friendly Page
- Mark as New
- Bookmark
- Subscribe
- Mute
- Subscribe to RSS Feed
- Permalink
- Report Inappropriate Content
Unable to open Pipeline: Failed to load resource - Request is blocked by upstream service
Hello,
I am having issues with Pipelines that started this morning:
Note: nothing else is currently running on the monitoring hub.
My only scheduled pipeline failed this morning; when trying to see the details of the "run (through "Recent Runs" or through the "Monitoring Hub", I get "Your request was rejected due to resource constratraints. Try again later"
Also, I am unable to open (edit) any pipelines; when the editor tries to open, I get a "Failed to load resource xxxxxx-xxxx-xxxx-xxxx-xxxxxxx; request failed with 429(Too many requests): Request is blocked by upstream service" notification.
Here is the related Activity Id:
- Mark as New
- Bookmark
- Subscribe
- Mute
- Subscribe to RSS Feed
- Permalink
- Report Inappropriate Content
Hi @JFTxJ
Thanks for raising the support ticket. Sorry for the inconvenience, I observe that some of the users are also facing the similar issue.
I have escalated this to our internal team and will definitely come back to you if I get an update. Please continue using Fabric Community for help regarding your queries.
Appreciate your patience.
- Mark as New
- Bookmark
- Subscribe
- Mute
- Subscribe to RSS Feed
- Permalink
- Report Inappropriate Content
I am also receiving this error - would love an update if anyone here finds a solution.
- Mark as New
- Bookmark
- Subscribe
- Mute
- Subscribe to RSS Feed
- Permalink
- Report Inappropriate Content
This is due to your workspace capacity running into throttling. It should recover automatically, if the capacity is not stressed any further. Adding @mihirwagleMSFT who is the product owner for the Fabric capacities.
- Mark as New
- Bookmark
- Subscribe
- Mute
- Subscribe to RSS Feed
- Permalink
- Report Inappropriate Content
Hi @ajarora ,
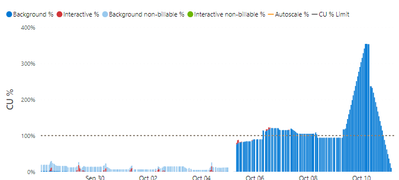
Thank you for your input. I agree with you that I am running into throttling (from the error message). However, this is the first time that this issue happens after many weeks of using our fabric capacity, and the behavior started on a holiday (Thanksgiving in Canada) and no-one was working on Fabric at the time.
However, using the Fabric Capacity Metric report, I can clearly see that we were overutilizing our capacity:

|
However, even now that the capacity has gone back down below our 100% levels, we are still experiencing the same issue (unable to open notebooks, pipelines, and all dataflows are still failing).
I have open a support ticket (case 2310100040008022) and I am getting feedback from support that there is something wrong with accessing the Blob storage in the backend and that would be the underlying cause of the issue. I will be confirming configuration of the Azure Datalake storage with them today and I will update here if there is any progress.
- Mark as New
- Bookmark
- Subscribe
- Mute
- Subscribe to RSS Feed
- Permalink
- Report Inappropriate Content
Hi @JFTxJ
Apologies for the delay in the response.
Just wanted to check whether your issue got resolved. Continue using Fabric Community for help regarding your queries.
Thanks
- Mark as New
- Bookmark
- Subscribe
- Mute
- Subscribe to RSS Feed
- Permalink
- Report Inappropriate Content
@dirkdunn when did this behavior start for you?
From my logs, it looks like my issues started on Oct 6th
- Mark as New
- Bookmark
- Subscribe
- Mute
- Subscribe to RSS Feed
- Permalink
- Report Inappropriate Content
Yes, I am receiving this error as well, I hope you get an answer soon!
Helpful resources
| User | Count |
|---|---|
| 4 | |
| 3 | |
| 2 | |
| 2 | |
| 1 |
| User | Count |
|---|---|
| 7 | |
| 5 | |
| 3 | |
| 3 | |
| 3 |


