FabCon is coming to Atlanta
Join us at FabCon Atlanta from March 16 - 20, 2026, for the ultimate Fabric, Power BI, AI and SQL community-led event. Save $200 with code FABCOMM.
Register now!- Power BI forums
- Get Help with Power BI
- Desktop
- Service
- Report Server
- Power Query
- Mobile Apps
- Developer
- DAX Commands and Tips
- Custom Visuals Development Discussion
- Health and Life Sciences
- Power BI Spanish forums
- Translated Spanish Desktop
- Training and Consulting
- Instructor Led Training
- Dashboard in a Day for Women, by Women
- Galleries
- Data Stories Gallery
- Themes Gallery
- Contests Gallery
- QuickViz Gallery
- Quick Measures Gallery
- Visual Calculations Gallery
- Notebook Gallery
- Translytical Task Flow Gallery
- TMDL Gallery
- R Script Showcase
- Webinars and Video Gallery
- Ideas
- Custom Visuals Ideas (read-only)
- Issues
- Issues
- Events
- Upcoming Events
The Power BI Data Visualization World Championships is back! Get ahead of the game and start preparing now! Learn more
- Power BI forums
- Forums
- Get Help with Power BI
- DAX Commands and Tips
- Re: Pull from a table the first transaction based ...
- Subscribe to RSS Feed
- Mark Topic as New
- Mark Topic as Read
- Float this Topic for Current User
- Bookmark
- Subscribe
- Printer Friendly Page

- Mark as New
- Bookmark
- Subscribe
- Mute
- Subscribe to RSS Feed
- Permalink
- Report Inappropriate Content
Pull from a table the first transaction based on a date column.
I have a transaction table(A) with 4 columns say X, Y, Value and Date. I want to create a new table(B) from Table A such that Table B have unique transactions(rows) based on the combination of X and Y columns, and should pick only first transaction based on the date column. For example -
Table A:
| X | Y | Value | Date |
| X1 | Y1 | 1 | 11-11-2022 |
| X1 | Y1 | 2 | 14-11-2022 |
| X2 | Y2 | 4 | 13-11-2022 |
Table B: It should only have one row for X1 and Y1 combination for date: 11-11-2022 as it is the first trasaction.
| X | Y | Value | Date |
| X1 | Y1 | 1 | 11-11-2022 |
| X2 | Y2 | 4 | 13-11-2022 |
Thanks in advance.
Solved! Go to Solution.

- Mark as New
- Bookmark
- Subscribe
- Mute
- Subscribe to RSS Feed
- Permalink
- Report Inappropriate Content
Hi @mak_tushar ,
Here are the steps you can follow:
1. Create calculated column.
Table 2 =
CALENDAR(
    MIN('Table'[Invoice Date]),MAX('Table'[Invoice Date]))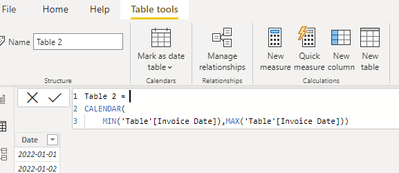
2. Create measure.
Flag =
var _select=SELECTEDVALUE('Table 2'[Date])
return
IF(
    MAX('Table'[Invoice Date])=
MINX(FILTER(ALL('Table'),'Table'[X]=MAX('Table'[X])&&'Table'[Y]=MAX('Table'[Y])&&'Table'[Location]=MAX('Table'[Location])&&'Table'[Invoice Date]>=_select),[Invoice Date]),1,0)
3. Place [Flag]in Filters, set is=1, apply filter.
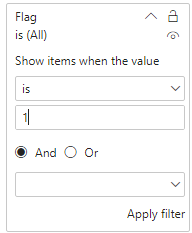
4. Result:

Best Regards,
Liu Yang
If this post helps, then please consider Accept it as the solution to help the other members find it more quickly
- Mark as New
- Bookmark
- Subscribe
- Mute
- Subscribe to RSS Feed
- Permalink
- Report Inappropriate Content
Hi @mak_tushar ,
Here are the steps you can follow:
1. Create calculated column.
Table 2 =
CALENDAR(
    MIN('Table'[Invoice Date]),MAX('Table'[Invoice Date]))
2. Create measure.
Flag =
var _select=SELECTEDVALUE('Table 2'[Date])
return
IF(
    MAX('Table'[Invoice Date])=
MINX(FILTER(ALL('Table'),'Table'[X]=MAX('Table'[X])&&'Table'[Y]=MAX('Table'[Y])&&'Table'[Location]=MAX('Table'[Location])&&'Table'[Invoice Date]>=_select),[Invoice Date]),1,0)
3. Place [Flag]in Filters, set is=1, apply filter.
4. Result:
Best Regards,
Liu Yang
If this post helps, then please consider Accept it as the solution to help the other members find it more quickly
- Mark as New
- Bookmark
- Subscribe
- Mute
- Subscribe to RSS Feed
- Permalink
- Report Inappropriate Content
Thanks @Anonymous, worked perfectly.
- Mark as New
- Bookmark
- Subscribe
- Mute
- Subscribe to RSS Feed
- Permalink
- Report Inappropriate Content
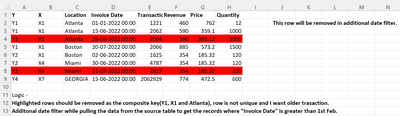
This is part of the previous one. Actually Table A has data for past 3 years and I want to have data only after 1 Feb in the new table. -


- Mark as New
- Bookmark
- Subscribe
- Mute
- Subscribe to RSS Feed
- Permalink
- Report Inappropriate Content
Try to create a new table with the code below:
B =
ADDCOLUMNS(
SUMMARIZE (
A,
A[X],
A[Y],
A[Value]
) ,
"Date",
CALCULATE (MIN(A[Date]))
)
- Mark as New
- Bookmark
- Subscribe
- Mute
- Subscribe to RSS Feed
- Permalink
- Report Inappropriate Content
Is there a way to apply filter on the date as well? I want to pull records from table A that have invoice date greater than 1 feb.
- Mark as New
- Bookmark
- Subscribe
- Mute
- Subscribe to RSS Feed
- Permalink
- Report Inappropriate Content
is it a new requirement or in addition to the previous one?Or could you elaborate the expected table in Excel?
- Mark as New
- Bookmark
- Subscribe
- Mute
- Subscribe to RSS Feed
- Permalink
- Report Inappropriate Content
This is part of the previous one. Actually Table A has data for past 3 years and I want to have data only after 1 Feb in the new table. -
- Mark as New
- Bookmark
- Subscribe
- Mute
- Subscribe to RSS Feed
- Permalink
- Report Inappropriate Content
Then try this:
B =
CALCULATETABLE(
ADDCOLUMNS(
SUMMARIZE (
A,
A[X],
A[Y],
A[Value]
) ,
"Date",
CALCULATE (MIN(A[Date]))
),
A[Date]>DATE(2022,1,1)
)
- Mark as New
- Bookmark
- Subscribe
- Mute
- Subscribe to RSS Feed
- Permalink
- Report Inappropriate Content
Getting duplicate rows (based on X and Y column).
- Mark as New
- Bookmark
- Subscribe
- Mute
- Subscribe to RSS Feed
- Permalink
- Report Inappropriate Content
how does the issue look like?
- Mark as New
- Bookmark
- Subscribe
- Mute
- Subscribe to RSS Feed
- Permalink
- Report Inappropriate Content
Is it an issue, considering you have different data in column Value and Date?
- Mark as New
- Bookmark
- Subscribe
- Mute
- Subscribe to RSS Feed
- Permalink
- Report Inappropriate Content
First two rows are duplicate as the first three coulmn values are same. Form these two(duplicate) rows, I want only the first row in my table as it has an older date.

Helpful resources

Power BI Dataviz World Championships
The Power BI Data Visualization World Championships is back! Get ahead of the game and start preparing now!

Power BI Monthly Update - November 2025
Check out the November 2025 Power BI update to learn about new features.

FabCon Atlanta 2026
Join us at FabCon Atlanta, March 16-20, for the ultimate Fabric, Power BI, AI and SQL community-led event. Save $200 with code FABCOMM.

| User | Count |
|---|---|
| 20 | |
| 10 | |
| 9 | |
| 4 | |
| 4 |


| User | Count |
|---|---|
| 34 | |
| 31 | |
| 20 | |
| 12 | |
| 11 |


