This time we’re going bigger than ever. Fabric, Power BI, SQL, AI and more. We're covering it all. You won't want to miss it.
Learn moreLevel up your Power BI skills this month - build one visual each week and tell better stories with data! Get started
Hello -
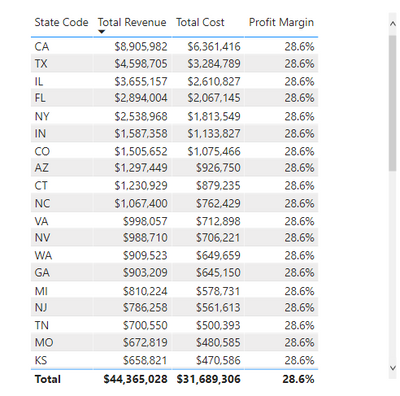
I am having trouble with the profit margin calculation. Here are my measures:
1. Total Revenue = SUMX( Sales, Sales[Order qty] * Sales[unit price] )
2. Total Cost = SUMX( Sales, Sales[Order qty] * Sales[unit cost] )
3. Total Profit = [Total Revenue]-[Total Cost]
4. Profit Margin = DIVIDE( [Total Profit], [Total Revenue], 0 )
However, when I show profit margin in a visual, all of the items in the category have the same profit margin. Any suggestions?
Thanks
It turns out the dataset was manually generated and the profit margin calc was indeed accurate. Sorry for the confusion.
@CMajka8 This generally indicates a missing relationship somewhere but if the Total Revenue and Total Cost columns in your visual are the measures you indicate that's rather strange.
Check out the April 2026 Power BI update to learn about new features.
Sign up to receive a private message when registration opens and key events begin.
If you have recently started exploring Fabric, we'd love to hear how it's going. Your feedback can help with product improvements.
| User | Count |
|---|---|
| 3 | |
| 3 | |
| 3 | |
| 3 | |
| 3 |
| User | Count |
|---|---|
| 8 | |
| 8 | |
| 7 | |
| 6 | |
| 6 |