- Power BI forums
- Updates
- News & Announcements
- Get Help with Power BI
- Desktop
- Service
- Report Server
- Power Query
- Mobile Apps
- Developer
- DAX Commands and Tips
- Custom Visuals Development Discussion
- Health and Life Sciences
- Power BI Spanish forums
- Translated Spanish Desktop
- Power Platform Integration - Better Together!
- Power Platform Integrations (Read-only)
- Power Platform and Dynamics 365 Integrations (Read-only)
- Training and Consulting
- Instructor Led Training
- Dashboard in a Day for Women, by Women
- Galleries
- Community Connections & How-To Videos
- COVID-19 Data Stories Gallery
- Themes Gallery
- Data Stories Gallery
- R Script Showcase
- Webinars and Video Gallery
- Quick Measures Gallery
- 2021 MSBizAppsSummit Gallery
- 2020 MSBizAppsSummit Gallery
- 2019 MSBizAppsSummit Gallery
- Events
- Ideas
- Custom Visuals Ideas
- Issues
- Issues
- Events
- Upcoming Events
- Community Blog
- Power BI Community Blog
- Custom Visuals Community Blog
- Community Support
- Community Accounts & Registration
- Using the Community
- Community Feedback
Register now to learn Fabric in free live sessions led by the best Microsoft experts. From Apr 16 to May 9, in English and Spanish.
- Power BI forums
- Forums
- Get Help with Power BI
- DAX Commands and Tips
- Re: How to get downtime per day when there are mul...
- Subscribe to RSS Feed
- Mark Topic as New
- Mark Topic as Read
- Float this Topic for Current User
- Bookmark
- Subscribe
- Printer Friendly Page
- Mark as New
- Bookmark
- Subscribe
- Mute
- Subscribe to RSS Feed
- Permalink
- Report Inappropriate Content
How to get downtime per day when there are multiple days between start and end date?
Hello,
I could use some help with my challenge.
In my organization we report machine downtimes with a [start] date/time and [end] date/time.
Example:
Unit 10 has a downtime
It started on 2-1-2022 at 19:31:34
And ended on 29-1-2022 at 07:54:13
The duration was 636,3775 hours (or 26,52 days)
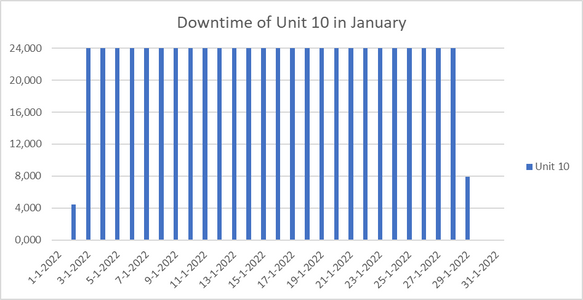
How can I make a graph (in Power Bi) which shows me the downtime for every single day? It's important not to loose the REASON column for filter purposes.
So:
First day of downtime: 4 hours 28 minutes and 26 seconds
Last day of downtime: 7 hours 54 minutes and 13 seconds
Every single day in between: 24 hours
Would result in:
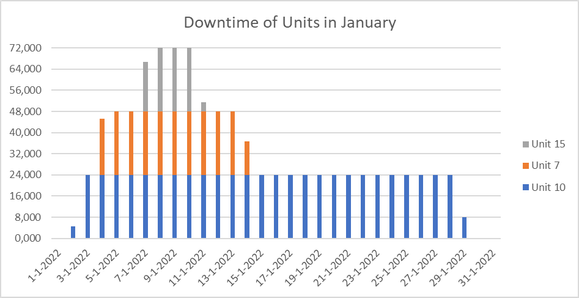
Eventually I need a graph which shows the downtime per day per machine, stacked. I.e.:
Any help or suggestions are greatly appreciated!
Thank you.
Solved! Go to Solution.
- Mark as New
- Bookmark
- Subscribe
- Mute
- Subscribe to RSS Feed
- Permalink
- Report Inappropriate Content
Hi @SteveMBSDO
Please refer to attached sample file with the proposed solution
Duration Time =
VAR DurationSeconds =
    SUMX (
        VALUES ( 'Date'[Date] ),
        VAR CurrentStartTime = 'Date'[Date]
        VAR CurrentEndTime = CurrentStartTime + TIME ( 23, 59, 59 )
        VAR FilteredTable = FILTER ( 'Table', CurrentStartTime IN CALENDAR ( 'Table'[Start].[Date], 'Table'[End].[Date] ) )
        RETURN
            SUMX (
                FilteredTable,
                DATEDIFF ( MAX ( CurrentStartTime, 'Table'[Start] ), MIN ( CurrentEndTime, 'Table'[End] ), SECOND )
            )
    )
VAR Hours = FORMAT ( QUOTIENT ( DurationSeconds, 3600 ), "00" )
VAR Minutes = FORMAT ( QUOTIENT ( MOD ( DurationSeconds, 3600 ), 60 ), "00" )
VAR Seconds = FORMAT ( MOD ( MOD ( DurationSeconds, 3600 ), 60 ), "00" )
RETURN
    IFERROR ( TIMEVALUE ( Hours & ":" & Minutes & ":" & Seconds ), BLANK () )
Duration Time 2 =
SUMX (
VALUES ( 'Date'[Date] ),
VAR CurrentStartTime = 'Date'[Date]
VAR CurrentEndTime = CurrentStartTime + TIME ( 23, 59, 59 )
VAR FilteredTable = FILTER ( 'Table', CurrentStartTime IN CALENDAR ( 'Table'[Start].[Date], 'Table'[End].[Date] ) )
RETURN
SUMX (
FilteredTable,
DATEDIFF ( MAX ( CurrentStartTime, 'Table'[Start] ), MIN ( CurrentEndTime, 'Table'[End] ), SECOND )
)
) / 3600
- Mark as New
- Bookmark
- Subscribe
- Mute
- Subscribe to RSS Feed
- Permalink
- Report Inappropriate Content
Great to see! Didn't think of that before. I was trying to split the input in multiple rows according to duration overflowing 24 hours. Thank you very much!
Helpful resources

Microsoft Fabric Learn Together
Covering the world! 9:00-10:30 AM Sydney, 4:00-5:30 PM CET (Paris/Berlin), 7:00-8:30 PM Mexico City

Power BI Monthly Update - April 2024
Check out the April 2024 Power BI update to learn about new features.

| User | Count |
|---|---|
| 47 | |
| 25 | |
| 19 | |
| 14 | |
| 10 |
| User | Count |
|---|---|
| 57 | |
| 49 | |
| 44 | |
| 18 | |
| 18 |


