FabCon is coming to Atlanta
Join us at FabCon Atlanta from March 16 - 20, 2026, for the ultimate Fabric, Power BI, AI and SQL community-led event. Save $200 with code FABCOMM.
Register now!- Power BI forums
- Get Help with Power BI
- Desktop
- Service
- Report Server
- Power Query
- Mobile Apps
- Developer
- DAX Commands and Tips
- Custom Visuals Development Discussion
- Health and Life Sciences
- Power BI Spanish forums
- Translated Spanish Desktop
- Training and Consulting
- Instructor Led Training
- Dashboard in a Day for Women, by Women
- Galleries
- Data Stories Gallery
- Themes Gallery
- Contests Gallery
- QuickViz Gallery
- Quick Measures Gallery
- Visual Calculations Gallery
- Notebook Gallery
- Translytical Task Flow Gallery
- TMDL Gallery
- R Script Showcase
- Webinars and Video Gallery
- Ideas
- Custom Visuals Ideas (read-only)
- Issues
- Issues
- Events
- Upcoming Events
The Power BI Data Visualization World Championships is back! Get ahead of the game and start preparing now! Learn more
- Power BI forums
- Forums
- Get Help with Power BI
- DAX Commands and Tips
- Re: Filter using What if parameter in a formula
- Subscribe to RSS Feed
- Mark Topic as New
- Mark Topic as Read
- Float this Topic for Current User
- Bookmark
- Subscribe
- Printer Friendly Page


- Mark as New
- Bookmark
- Subscribe
- Mute
- Subscribe to RSS Feed
- Permalink
- Report Inappropriate Content
Filter using What if parameter in a formula
Hi, I'm trying to find a way of filtering a report based on a simple calculation using the value set by the user on the dashboard, but I just can't find any way to make it work.
Basically I want to know which records were live ('in the pipeline') in the selected year. Using various dates I have calculated the year each record enters the pipeline and the year it leaves. The idea being to then filter the report using a column containing this formula:
Solved! Go to Solution.


- Mark as New
- Bookmark
- Subscribe
- Mute
- Subscribe to RSS Feed
- Permalink
- Report Inappropriate Content
Hi,
After my long time research and test, I finally figured out a method that uses a measure to replace the field [Units] which serves as the Value column of the pie chart:
Units Sum =

var _table=

FILTER('Pipeline data','Pipeline data'[Year enters pipeline]<='Select a year parameter'[Select a year parameter Value] &&'Pipeline data'[Year leaves pipeline]>'Select a year parameter'[Select a year parameter Value])

return

SUMX(_table,[Units])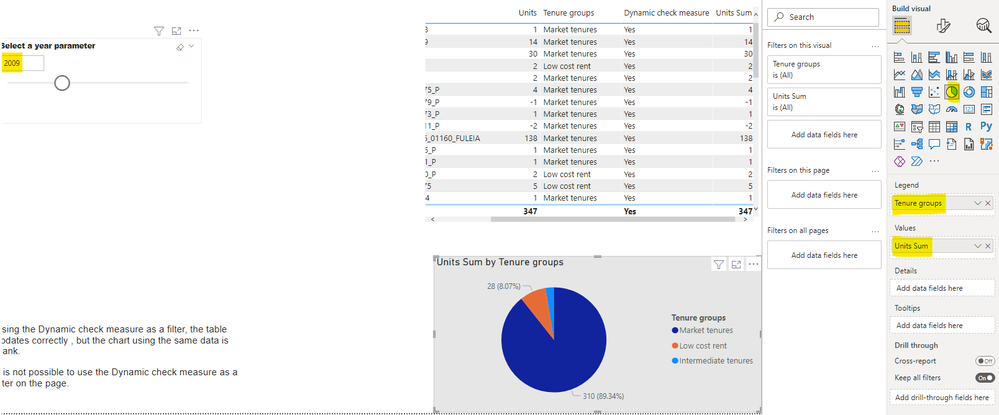
Thank you very much!
The sample pbix file is attached below.
Best Regards,
Community Support Team _Robert Qin
If this post helps, then please consider Accept it as the solution to help the other members find it more quickly.
- Mark as New
- Bookmark
- Subscribe
- Mute
- Subscribe to RSS Feed
- Permalink
- Report Inappropriate Content
Hi,
After my long time research and test, I finally figured out a method that uses a measure to replace the field [Units] which serves as the Value column of the pie chart:
Units Sum =

var _table=

FILTER('Pipeline data','Pipeline data'[Year enters pipeline]<='Select a year parameter'[Select a year parameter Value] &&'Pipeline data'[Year leaves pipeline]>'Select a year parameter'[Select a year parameter Value])

return

SUMX(_table,[Units])
Thank you very much!
The sample pbix file is attached below.
Best Regards,
Community Support Team _Robert Qin
If this post helps, then please consider Accept it as the solution to help the other members find it more quickly.
- Mark as New
- Bookmark
- Subscribe
- Mute
- Subscribe to RSS Feed
- Permalink
- Report Inappropriate Content
Hi,
According to your description, I can roughly understand what you want to get. Would you like to post some sample data in table form or pbix file(without sensitive data) and your expected result(like the chart you want to get and the correct measure value based on your sample data)?
Thanks very much!
How to Get Your Question Answered Quickly
Best Regards,
Community Support Team _Robert Qin
If this post helps, then please consider Accept it as the solution to help the other members find it more quickly.
- Mark as New
- Bookmark
- Subscribe
- Mute
- Subscribe to RSS Feed
- Permalink
- Report Inappropriate Content
Hi, hopefully this file shows the issue.
Let me know if you need any more information or can't access the file.
Thanks
- Mark as New
- Bookmark
- Subscribe
- Mute
- Subscribe to RSS Feed
- Permalink
- Report Inappropriate Content
Hi,
According to your description, I can roughly understand your requirement, I think the reason why your DAX formula can’t work is that you have to use the value of the measure [Parameter Value] in the What-if parameter you created, you can try my method to achieve this:
This is the test data I created based on your description:

Then I create a What-if parameter like this:
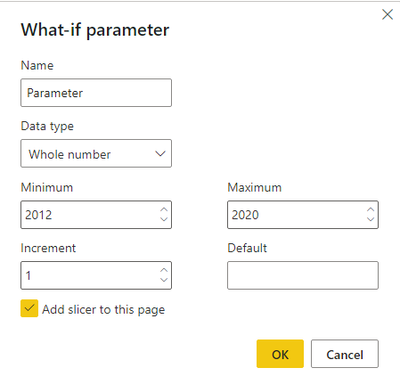
Then create a measure like this:
Pipeline check =

IF(MAX('Pipeline'[Year enters pipeline])<=[Parameter Value]&&MAX('Pipeline'[Year leaves pipeline])>[Parameter Value],"Yes","No")
And you can create a table chart to place it like this and apply the visual filter like this to get what you want, like this:
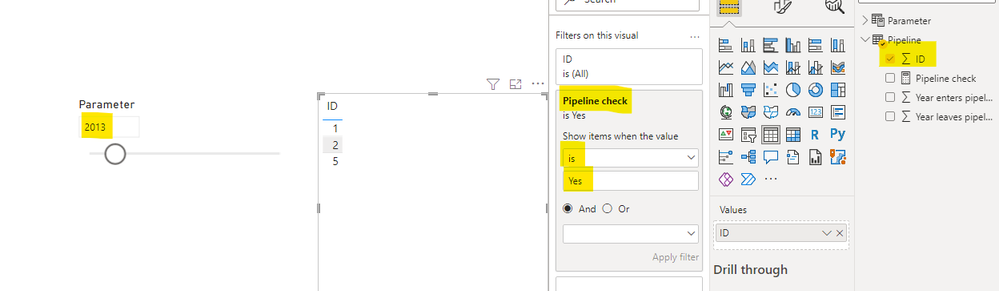
You can download my test pbix file below
If this result is not what you want, you can post some sample data(without sensitive data) and your expected result.
How to Get Your Question Answered Quickly
Thank you very much!
Best Regards,
Community Support Team _Robert Qin
If this post helps, then please consider Accept it as the solution to help the other members find it more quickly.


- Mark as New
- Bookmark
- Subscribe
- Mute
- Subscribe to RSS Feed
- Permalink
- Report Inappropriate Content
Hi Jon:
You an try something along the lines of:
- Mark as New
- Bookmark
- Subscribe
- Mute
- Subscribe to RSS Feed
- Permalink
- Report Inappropriate Content
Hi, many thanks for your swift response!
I've tried updating my formula as follows:


- Mark as New
- Bookmark
- Subscribe
- Mute
- Subscribe to RSS Feed
- Permalink
- Report Inappropriate Content
Hey,
Perhaps you already did, but check datatypes, they should match for the two fields you're comparing.
Also, instead of IF(AND(Pipeline[Year enters pipeline]<=yearcheck,Pipeline[Year leaves pipeline]>yearcheck),"Yes","No")
write selectedvalue for both
-->
IF(AND(SELECTEDVALUE(Pipeline[Year enters pipeline])<=yearcheck,SELECTEDVALUE(Pipeline[Year leaves pipeline])>yearcheck),"Yes","No")
- Mark as New
- Bookmark
- Subscribe
- Mute
- Subscribe to RSS Feed
- Permalink
- Report Inappropriate Content
Hi MargaritaG, many thanks for your suggestions. Unfortunately I still haven't found the magic formula to make this work.
SelectedValue only seems to be accepted in a formula when it is used with the data array in the Whatif parameter, e.g.

However, when the column formula is like this, nothing meets this critera, everything is No.
When I try to use SelectedValue with the slider value, the formula is not accepted.

I've tried wrapping the [Year enters pipeline] and [Year leaves pipeline] columns in SelectedValue, but again, everything is No.

The closest I can get to this working is without using SelectedValue, so:

This gives results, but it always uses the default value rather than the value on the slider. When I manually update the default value, the filter updates.
Is there a trick to getting this formula to updated with the slider?
The screenshot below shows this in the context of the dashboard. The slider is set to 2012, but the results are for 2020, which is the default for the Select a year value (shown in the formula bar at the top). You can see the results are for 2020 from the filters on the right. The column 2020/21 check hard-codes 2020 into the formula (
and has exactly the same number of results. This is confirmed by the screen shot below that shows the two filters with nothing ticked.

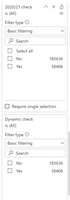
Apologies that this is all a bit messy, but hopefully it helps to explain what I am trying to achieve and where I am going wrong.
Thanks again
Jon
- Mark as New
- Bookmark
- Subscribe
- Mute
- Subscribe to RSS Feed
- Permalink
- Report Inappropriate Content
Hey,
I think it would be easier to understand if it works and what we are dealing with if you could add table visual of Item, [[Year Enters Pipeline], [Year Leaves Pipeline], [Measure with the logic]
Then it would be clear where it does not work.
- Mark as New
- Bookmark
- Subscribe
- Mute
- Subscribe to RSS Feed
- Permalink
- Report Inappropriate Content
Hi,
What I'm trying to create is a companion to this dashboard, but rather than focussing on what was granted each year I want to show what was still 'live' at the end of each year.
Each line of data only has one approval date, so for the approvals dashboard you can put the approval date in a slicer and all of the visuals will update when the slicer is changed.
For the pipeline, however, each line can be in multiple years (or none). I've created various objects in DAX to help me see if something is live at the end of the year; the formula to see what was live at the end of 2020/21 is:
2020/21 check = IF(AND([Year enters pipeline]<=2020,[Year leaves pipeline]>2020),"Yes","No"))
What I have been trying is to use a WhatIf parameter to replace the hard-coded dates in the formula above, then filter the report to only show the records that return "Yes" from this formula.
What Robert has shown above is that I can create a measure using the formula, and the data table (equivalent to the one on the third page of the approvals dashboard) will update as intended. However it doesn't seem to be compatible with the cards, cross-tabs and charts that are also included in the report. If I use the formula in a Column, which is what I had been trying (as it seems to be the only way to use it as a filter on all of the various visuals, across pages etc), it doesn't respond to the slider.
I'm trying to get to the point where I have a slicer, slider or whatever, that lets the user select the year. This needs to work in tandem with the filters by borough, type of supply etc and lead to the tables, cards and charts updating.
Apologies again that I am not explaining this very well, and many thanks for taking the time to read and respond to my posts!
Jon

Helpful resources

Power BI Monthly Update - November 2025
Check out the November 2025 Power BI update to learn about new features.

Fabric Data Days
Advance your Data & AI career with 50 days of live learning, contests, hands-on challenges, study groups & certifications and more!

FabCon Atlanta 2026
Join us at FabCon Atlanta, March 16-20, for the ultimate Fabric, Power BI, AI and SQL community-led event. Save $200 with code FABCOMM.

| User | Count |
|---|---|
| 21 | |
| 10 | |
| 9 | |
| 4 | |
| 4 |


| User | Count |
|---|---|
| 35 | |
| 31 | |
| 19 | |
| 13 | |
| 10 |


