Fabric Data Days starts November 4th!
Advance your Data & AI career with 50 days of live learning, dataviz contests, hands-on challenges, study groups & certifications and more!
Get registered- Power BI forums
- Get Help with Power BI
- Desktop
- Service
- Report Server
- Power Query
- Mobile Apps
- Developer
- DAX Commands and Tips
- Custom Visuals Development Discussion
- Health and Life Sciences
- Power BI Spanish forums
- Translated Spanish Desktop
- Training and Consulting
- Instructor Led Training
- Dashboard in a Day for Women, by Women
- Galleries
- Data Stories Gallery
- Themes Gallery
- Contests Gallery
- QuickViz Gallery
- Quick Measures Gallery
- Visual Calculations Gallery
- Notebook Gallery
- Translytical Task Flow Gallery
- TMDL Gallery
- R Script Showcase
- Webinars and Video Gallery
- Ideas
- Custom Visuals Ideas (read-only)
- Issues
- Issues
- Events
- Upcoming Events
Get Fabric Certified for FREE during Fabric Data Days. Don't miss your chance! Request now
- Power BI forums
- Forums
- Get Help with Power BI
- DAX Commands and Tips
- Re: Filter for multiple values in one cell
- Subscribe to RSS Feed
- Mark Topic as New
- Mark Topic as Read
- Float this Topic for Current User
- Bookmark
- Subscribe
- Printer Friendly Page

- Mark as New
- Bookmark
- Subscribe
- Mute
- Subscribe to RSS Feed
- Permalink
- Report Inappropriate Content
Filter for multiple values in one cell
Hello,
i have a data model in which the main table sometimes includes columns in which several values are included in one cell to minimize the numer of rows and columns needed.
e.g.
| Risks | IT-Protection Goals |
| G0.1; G0.2; G0.45; G036 | C; I; A |
| G0.8; G0.1; G0.2; | C; A |
| ... | I |
I know want PowerBI to detect e.g. G0.2 in one of the cells and not view the content of the cell as one value. I know that I could split the data into several columns but I specifially want to avoid that and put all the individual values into one cell.
Help of any kind would be highly appreciated.
Best
Justus
Solved! Go to Solution.


- Mark as New
- Bookmark
- Subscribe
- Mute
- Subscribe to RSS Feed
- Permalink
- Report Inappropriate Content
@KubenM
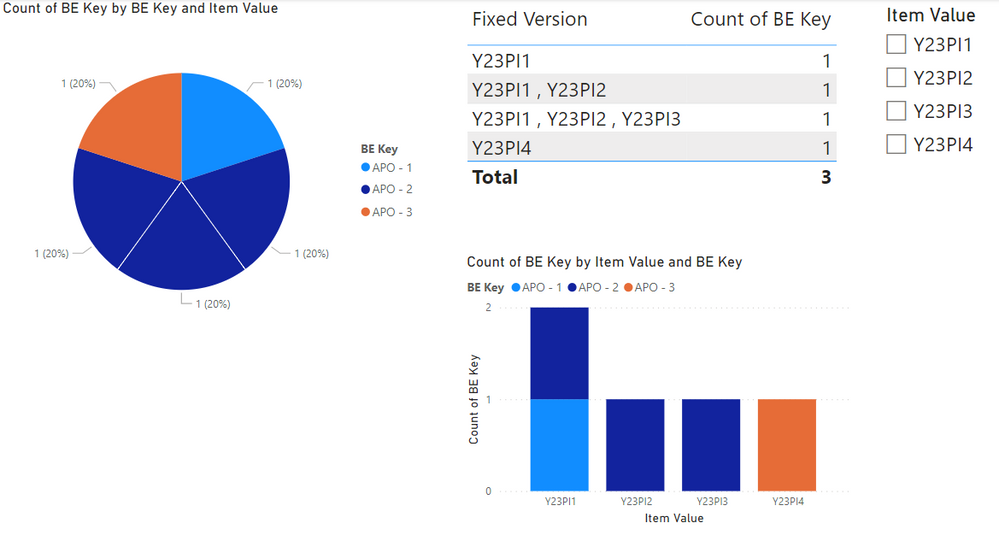
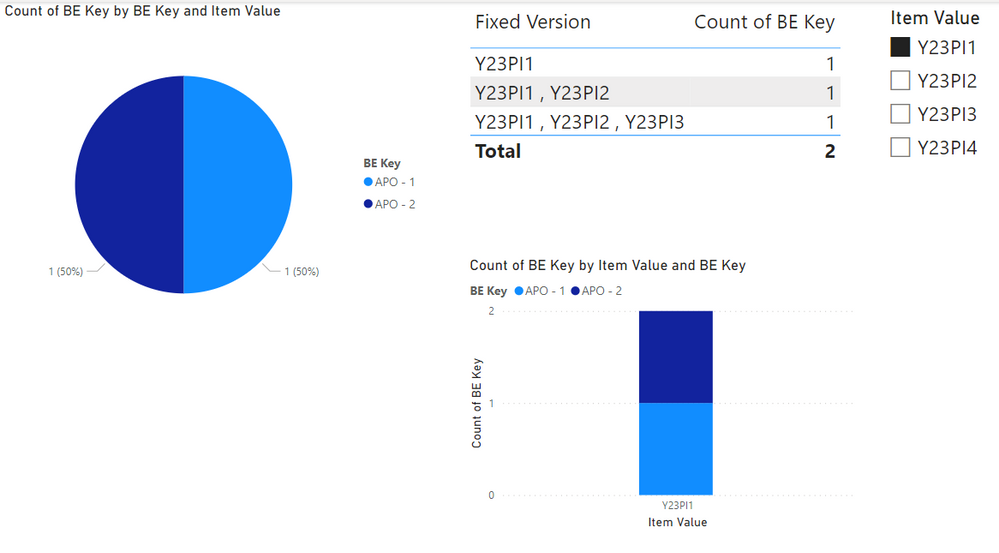
Sorry for the late response. I was trapped in a couple of meetings. I hope the following is what you're looking for.

Count of BE Key =
CALCULATE (
    COUNTROWS ( VALUES ( 'Table'[BE Key] ) ),
    FILTER (
        'Table',
        VAR SelectedValues = VALUES ( FilterTable[Item Value] )
        VAR String = 'Table'[Fixed Version]
        VAR Items = SUBSTITUTE ( String, " , ", "|" )
        VAR Length = COALESCE ( PATHLENGTH ( Items ), 1 )
        VAR T1 = GENERATESERIES ( 1, Length, 1 )
        VAR T2 = SELECTCOLUMNS ( T1, "@Item", PATHITEM ( Items, [Value] ) )
        RETURN
            COUNTROWS ( INTERSECT ( T2, SelectedValues ) )
    )
)

- Mark as New
- Bookmark
- Subscribe
- Mute
- Subscribe to RSS Feed
- Permalink
- Report Inappropriate Content
Hello
I have a similar challenge. I am trying to stay away from complex DAX.
I have a filter setup for Increment that uses a Fact Table that has the following individual values defined:
Y23PI1
Y23PI2
Y23PI3
Y23PI4
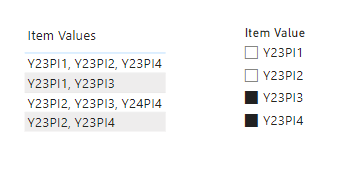
My dimension table reflects that some rows have mulitple Increments in the same cell for example: Y23PI1, Y23PI2 or Y23PI2, Y23PI3, Y24PI4
As my filter only references single Increments, when I filter on Y23PI1 or Y23PI2, Power Bi returns zero as it can't find the single Increments.
Please assist if possible.
Kind Regards
- Mark as New
- Bookmark
- Subscribe
- Mute
- Subscribe to RSS Feed
- Permalink
- Report Inappropriate Content
@KubenM
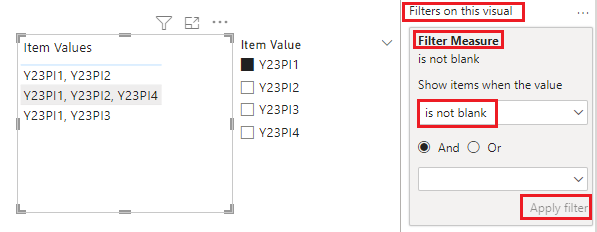
I don't beleive there is any solution other than DAX. However it is not as complex as you might think. Please refer to attached sample file with the proposed solution
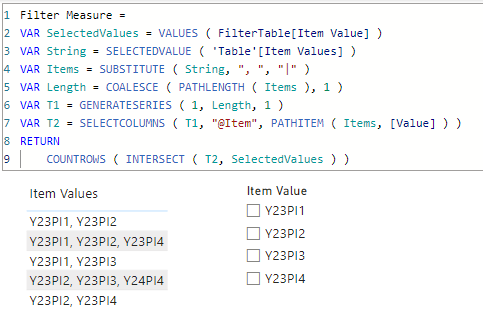
Filter Measure =
VAR SelectedValues = VALUES ( FilterTable[Item Value] )
VAR String = SELECTEDVALUE ( 'Table'[Item Values] )
VAR Items = SUBSTITUTE ( String, ", ", "|" )
VAR Length = COALESCE ( PATHLENGTH ( Items ), 1 )
VAR T1 = GENERATESERIES ( 1, Length, 1 )
VAR T2 = SELECTCOLUMNS ( T1, "@Item", PATHITEM ( Items, [Value] ) )
RETURN
COUNTROWS ( INTERSECT ( T2, SelectedValues ) )- Mark as New
- Bookmark
- Subscribe
- Mute
- Subscribe to RSS Feed
- Permalink
- Report Inappropriate Content
Hello tamerj1
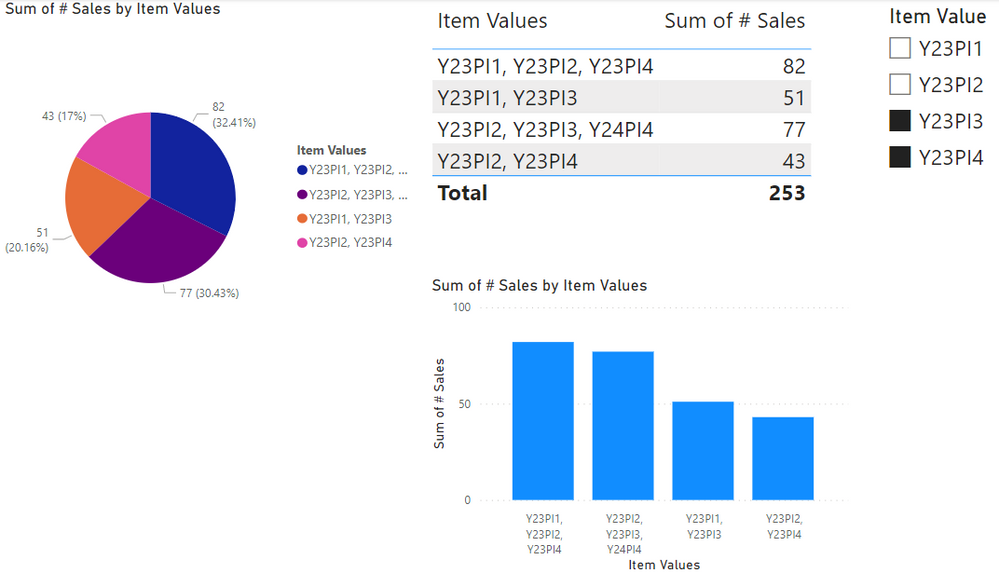
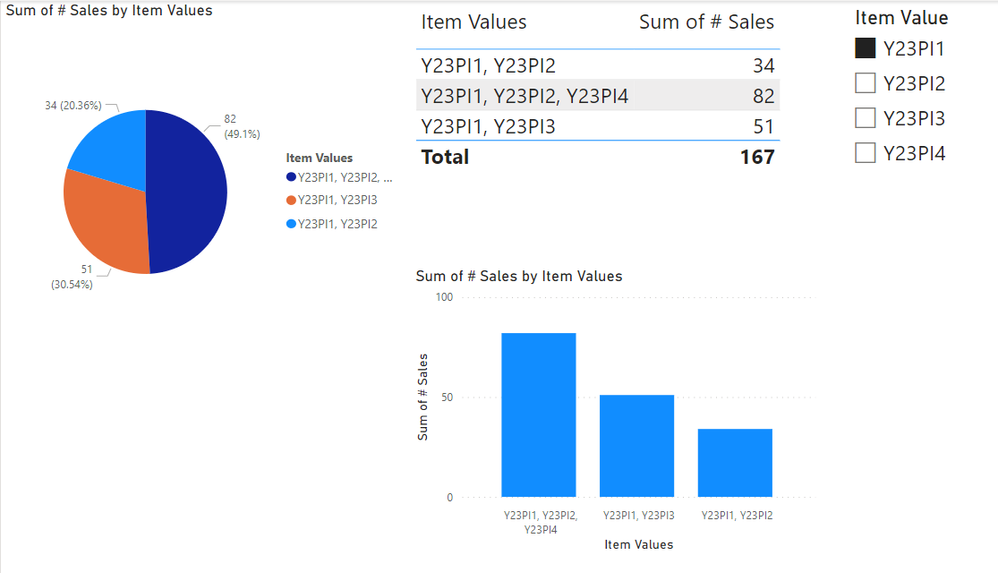
I applied the DAX to the Matrix and the filtering works perfectly. I now have a challenge with applying the same DAX to the Pie charts and Bar Charts that are on the same Report. I am not able to filter these visuals by Increment.
Would you be able to add another column to the data table and add for example # of Sales and create the two visuals and apply the Filter Measure to these visuals so that I can follow your example.
And is there a way to sum each increment on the Pie chart when I filter on for example Y23PI1 so that the PIE chart shows a complete PIE as a sum of the vaules(# of Sales) for Increment Y23PI1 and not show me Y23PI1 in muliple slices of the PIE based on how the Item Values are distributed. When I select Y23PI1 and Y23P2, I would like the PIE chart to show two slices ie one slice for each Increment. I hope that makes sense.
Much appreciated.
- Mark as New
- Bookmark
- Subscribe
- Mute
- Subscribe to RSS Feed
- Permalink
- Report Inappropriate Content
- Mark as New
- Bookmark
- Subscribe
- Mute
- Subscribe to RSS Feed
- Permalink
- Report Inappropriate Content
The bar chart should also only show the values for one Increment per bar.
- Mark as New
- Bookmark
- Subscribe
- Mute
- Subscribe to RSS Feed
- Permalink
- Report Inappropriate Content
Hello Again
Thank you for your speedy response.
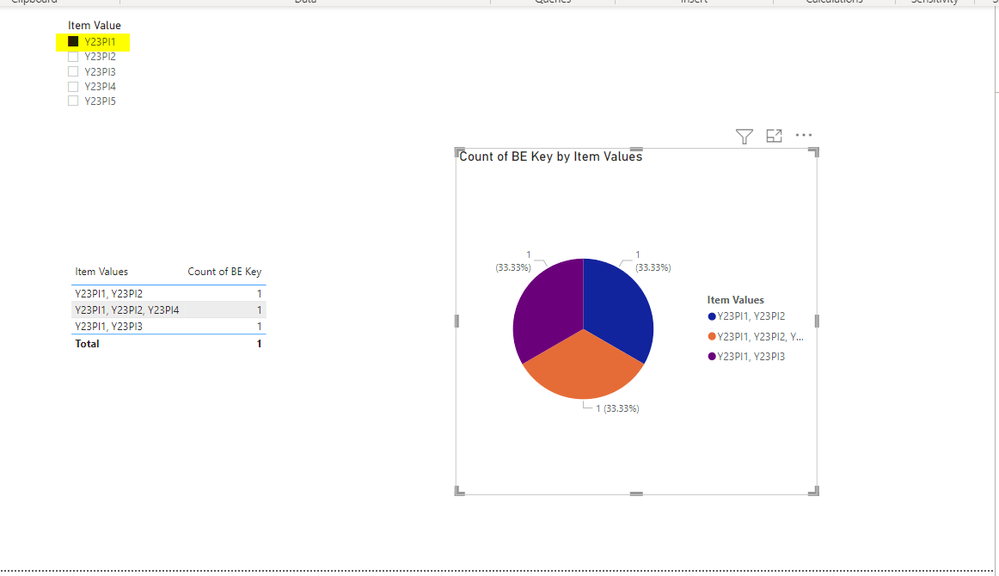
With reference to the PIE chart in the screen shot below, and the selection of Filter option Y23PI1 on the filter, I would like the PIE Chart to show me the count of 1 and the legend to show Y23PI1 and not 3 slices of the pie.
- Mark as New
- Bookmark
- Subscribe
- Mute
- Subscribe to RSS Feed
- Permalink
- Report Inappropriate Content
@KubenM
Why the count should be 1 not 3? And for the bar chart, what do you mean by "one increment per bar"?
- Mark as New
- Bookmark
- Subscribe
- Mute
- Subscribe to RSS Feed
- Permalink
- Report Inappropriate Content
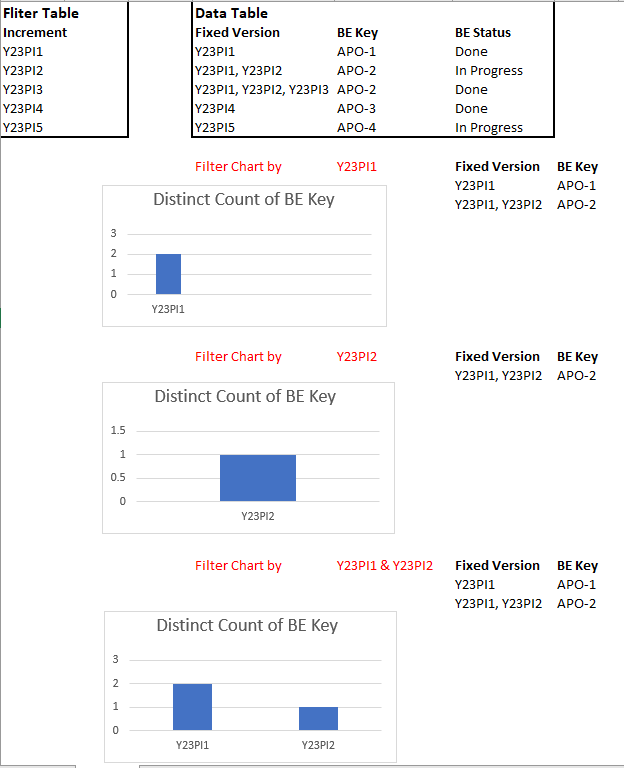
So all the visuals should show data per a defined list of PI dates:
Y23PI1
Y23PI2
Y23PI3
Y23PI4
Y23PI5
Each Bar visual should therefore only show these defined PI dates and not show for example a combination of PI dates like a column for "Y23PI1, Y23PI2" and another column showing 3 PI dates.
Based on my previous comment, we would like to see how many Business Epics have been planned per PI even if the same Business Epic rolled over from one PI to PI. So the key here is to show the single PI date and how many Business Epics were planned in that particular PI date.
- Mark as New
- Bookmark
- Subscribe
- Mute
- Subscribe to RSS Feed
- Permalink
- Report Inappropriate Content
@KubenM
This is exactly what I though. Please provide a reasonable set of sample dummy data that simulates the situation in order to work with.
- Mark as New
- Bookmark
- Subscribe
- Mute
- Subscribe to RSS Feed
- Permalink
- Report Inappropriate Content
I hope this illustration helps.
- Mark as New
- Bookmark
- Subscribe
- Mute
- Subscribe to RSS Feed
- Permalink
- Report Inappropriate Content
@KubenM
Sorry for the late response. I was trapped in a couple of meetings. I hope the following is what you're looking for.
Count of BE Key =
CALCULATE (
    COUNTROWS ( VALUES ( 'Table'[BE Key] ) ),
    FILTER (
        'Table',
        VAR SelectedValues = VALUES ( FilterTable[Item Value] )
        VAR String = 'Table'[Fixed Version]
        VAR Items = SUBSTITUTE ( String, " , ", "|" )
        VAR Length = COALESCE ( PATHLENGTH ( Items ), 1 )
        VAR T1 = GENERATESERIES ( 1, Length, 1 )
        VAR T2 = SELECTCOLUMNS ( T1, "@Item", PATHITEM ( Items, [Value] ) )
        RETURN
            COUNTROWS ( INTERSECT ( T2, SelectedValues ) )
    )
)- Mark as New
- Bookmark
- Subscribe
- Mute
- Subscribe to RSS Feed
- Permalink
- Report Inappropriate Content
Hello @tamerj1 Happy Sunday 🙂
I trust that you well.
I spent my entire weekend applying your amazing DAX to all my visuals and everything works perfectly except for one visual that is being naughty 🙂
Your DAX is 100% correct. The visual I am having difficulty with needs a rule to be applied to the BE Key data and must only return those BEs that are in the Done status.
This is the DAX I created to achieve the desired result but I have no idea how to merge this DAX with the filter DAX you created for with me.
- Mark as New
- Bookmark
- Subscribe
- Mute
- Subscribe to RSS Feed
- Permalink
- Report Inappropriate Content
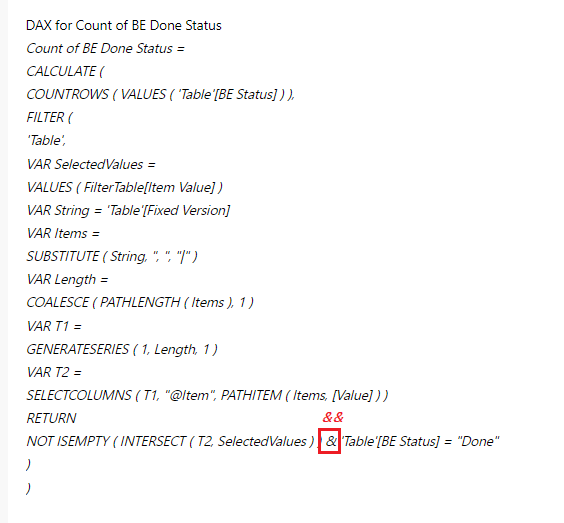
Please try
Count of BE Key =
CALCULATE (
COUNTROWS ( VALUES ( 'Table'[BE Key] ) ),
FILTER (
'Table',
VAR SelectedValues =
VALUES ( FilterTable[Item Value] )
VAR String = 'Table'[Fixed Version]
VAR Items =
SUBSTITUTE ( String, " , ", "|" )
VAR Length =
COALESCE ( PATHLENGTH ( Items ), 1 )
VAR T1 =
GENERATESERIES ( 1, Length, 1 )
VAR T2 =
SELECTCOLUMNS ( T1, "@Item", PATHITEM ( Items, [Value] ) )
RETURN
NOT ISEMPTY ( INTERSECT ( T2, SelectedValues ) ) & 'Table'[Status] = "Done"
)
)
- Mark as New
- Bookmark
- Subscribe
- Mute
- Subscribe to RSS Feed
- Permalink
- Report Inappropriate Content
Dear @tamerj1 The DAX did it's magic. You are absolutely awesome. WoW
Thank you so much for your incredible support. I might have one more challenge with another visual but I am going to first try apply your latest DAX to the visual and see what happens 🙂
- Mark as New
- Bookmark
- Subscribe
- Mute
- Subscribe to RSS Feed
- Permalink
- Report Inappropriate Content
Hello @tamerj1
Thank you for your feedback.
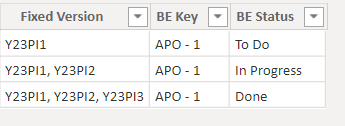
I applied the DAX and edited the dataset to only show one BE that rolled over for Y23PI1(To Do) to Y23PI2(In Progress) and then to Y23PI3(Done) and it isn't returning the correct count.
Please see below.
My question is, how would the DAX know that the BE(APO - 1) only reached the Done status in Y23PI3?
Table
DAX for Count of BE Done Status
Visual Based on the DAX applied
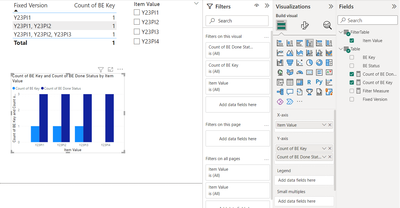
Based on the Table values, the Bar chart should only display the Count of 1 BE in the Done staus in Increment Y23PI3.
I must apologise for the complexity in my requirement.
- Mark as New
- Bookmark
- Subscribe
- Mute
- Subscribe to RSS Feed
- Permalink
- Report Inappropriate Content
- Mark as New
- Bookmark
- Subscribe
- Mute
- Subscribe to RSS Feed
- Permalink
- Report Inappropriate Content
Hello @tamerj1
Here’s my last query on the report I am building 😊
Based on the DAX filter you so generously built for me, how do I add the following DAX to it:
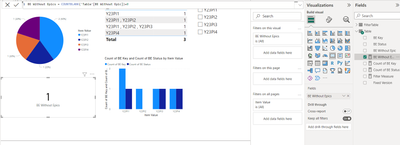
BE Without Epics = COUNTBLANK('Table'[BE Without Epic])+0
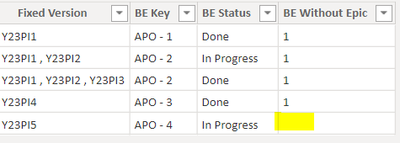
- In the data Table I added a column called “BE Without Epic” and in the column fields I entered 1 for where a BE has an Epic and left a Blank for the BE (APO – 4) that does not have an Epic.
- My card visual shows a 1 based on my simple COUNTBLANK DAX.
- When I filter on Y23PI1 or Y23PI2 or Y23PI3 or Y23PI4 the card must return 0.
- When I remove the filter selections or select F23PI5, the card must return 1.
- Mark as New
- Bookmark
- Subscribe
- Mute
- Subscribe to RSS Feed
- Permalink
- Report Inappropriate Content
Count of BE With Epic =
COUNTROWS (
FILTER (
'Table',
VAR SelectedValues =
VALUES ( FilterTable[Item Value] )
VAR String = 'Table'[Fixed Version]
VAR Items =
SUBSTITUTE ( String, ", ", "|" )
VAR Length =
COALESCE ( PATHLENGTH ( Items ), 1 )
VAR T1 =
GENERATESERIES ( 1, Length, 1 )
VAR T2 =
SELECTCOLUMNS ( T1, "@Item", PATHITEM ( Items, [Value] ) )
RETURN
NOT ISEMPTY ( INTERSECT ( T2, SelectedValues ) )
&& 'Table'[BE Without Epic] = BLANK ()
)
) + 0
- Mark as New
- Bookmark
- Subscribe
- Mute
- Subscribe to RSS Feed
- Permalink
- Report Inappropriate Content
Hello @tamerj1 Trust that you well. Not sure if I should create a brand new entry or keep my next question in this current response flow.
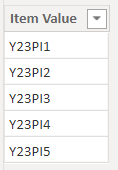
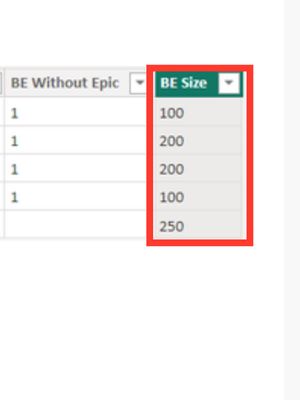
I am trying to edit the original DAX you created for me to include a new column called BE Size and the visual is only returning the count of BE and not showing the sum of the Story Points per BE size. See information I used below to inform my challenge.
Sum of BE Size
Table

FilterTable
DAX
Count of BE Size =
CALCULATE (
COUNTROWS ( VALUES ( 'Table'[BE Key] ) ),
FILTER (
'Table',
VAR SelectedValues =
VALUES ( FilterTable[Item Value] )
VAR String = 'Table'[Fixed Version]
VAR Items =
SUBSTITUTE ( String, ", ", "|" )
VAR Length =
COALESCE ( PATHLENGTH ( Items ), 1 )
VAR T1 =
GENERATESERIES ( 1, Length, 1 )
VAR T2 =
SELECTCOLUMNS ( T1, "@Item", PATHITEM ( Items, [Value] ) )
RETURN
NOT ISEMPTY ( INTERSECT ( T2, SelectedValues ) ) && 'Table'[BE Size]
))+0
Visual
How do I refine the DAX so that the Visual displays the Data Labels as Count of Size ie, 100 or 200 and the Total Labels to show size ie. 100 or 200, etc?
Note: The current visual isn’t reflecting the correct count.
Y23PI1 should show a stacked bar of 100 and 200 and the total label to show 300.
Y23PI2 should show a stacked bar of 200 and the total label to show 200
Y23PI3 should show a stacked bar of 200 and a total label of 200
Y23PI4 should show a stacked bar of 100 and a total label of 100
Y23PI5 should show a stacked bar of 250 and a total label of 250
- Mark as New
- Bookmark
- Subscribe
- Mute
- Subscribe to RSS Feed
- Permalink
- Report Inappropriate Content

Helpful resources

Fabric Data Days
Advance your Data & AI career with 50 days of live learning, contests, hands-on challenges, study groups & certifications and more!

Power BI Monthly Update - October 2025
Check out the October 2025 Power BI update to learn about new features.

FabCon Atlanta 2026
Join us at FabCon Atlanta, March 16-20, for the ultimate Fabric, Power BI, AI and SQL community-led event. Save $200 with code FABCOMM.

| User | Count |
|---|---|
| 7 | |
| 6 | |
| 4 | |
| 4 | |
| 4 |


| User | Count |
|---|---|
| 25 | |
| 17 | |
| 9 | |
| 8 | |
| 7 |


