FabCon is coming to Atlanta
Join us at FabCon Atlanta from March 16 - 20, 2026, for the ultimate Fabric, Power BI, AI and SQL community-led event. Save $200 with code FABCOMM.
Register now!- Power BI forums
- Get Help with Power BI
- Desktop
- Service
- Report Server
- Power Query
- Mobile Apps
- Developer
- DAX Commands and Tips
- Custom Visuals Development Discussion
- Health and Life Sciences
- Power BI Spanish forums
- Translated Spanish Desktop
- Training and Consulting
- Instructor Led Training
- Dashboard in a Day for Women, by Women
- Galleries
- Data Stories Gallery
- Themes Gallery
- Contests Gallery
- QuickViz Gallery
- Quick Measures Gallery
- Visual Calculations Gallery
- Notebook Gallery
- Translytical Task Flow Gallery
- TMDL Gallery
- R Script Showcase
- Webinars and Video Gallery
- Ideas
- Custom Visuals Ideas (read-only)
- Issues
- Issues
- Events
- Upcoming Events
The Power BI Data Visualization World Championships is back! Get ahead of the game and start preparing now! Learn more
- Power BI forums
- Forums
- Get Help with Power BI
- DAX Commands and Tips
- Re: ExamplePbix Added - Select first row of differ...
- Subscribe to RSS Feed
- Mark Topic as New
- Mark Topic as Read
- Float this Topic for Current User
- Bookmark
- Subscribe
- Printer Friendly Page


- Mark as New
- Bookmark
- Subscribe
- Mute
- Subscribe to RSS Feed
- Permalink
- Report Inappropriate Content
ExamplePbix Added - Select first row of different rows with same calculated column value
Hi!
I'm working with basketball data and trying to get how much time is playing every defensive five (column). With the help of the community, I found the correct DAX formula to calculate it (the one below) but there is a specific case (due to a mistake in the data entry), that I need to control.
The raw data has an index column (a countrow) [Name = VsBilbao(Index)] so I guess I could use it to take the MIN of the "Index" column when there are multiple rows with the same "TimeOnCourt" and different value in "VsBilbao[DefensiveFive]" but I don't know where to put it in the formula below.
The formula is working except for the exceptional case:
Solved! Go to Solution.


- Mark as New
- Bookmark
- Subscribe
- Mute
- Subscribe to RSS Feed
- Permalink
- Report Inappropriate Content
Hi , @sfernamer
Thanks for your quick response ! Do you mean the [TimeOnCount] vaule in the [Def3] context filter is wrong .
You can try to use this dax to get the [TimeOnCount] .
TimeOnCount Test = var _t  =FILTER( SUMMARIZE(ALLSELECTED('Hoja1'),'Hoja1'[Full_Quarter] , 'Hoja1'[Time_Def] , 'Hoja1'[Defensive Five] , 'Hoja1'[Def3] ,'Hoja1'[TimeOnCourt] , "flag" , [Test_Flag 2]) , [flag] = 1)
var _cur_def3 =VALUES(Hoja1[Def3])
var _t2= SUMMARIZE(_t ,[Def3],"timeoncount" ,[Grouped_TimeOnCourt_D5])
return
SUMX(FILTER(_t2,[Def3] in _cur_def3) , [timeoncount])
The result is as follows:
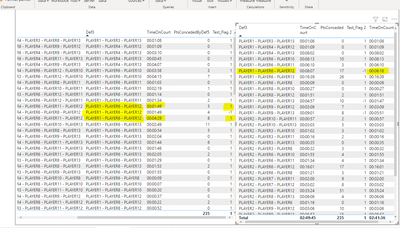
Thank you for your time and sharing, and thank you for your support and understanding of PowerBI!
Best Regards,
Aniya Zhang
If this post helps, then please consider Accept it as the solution to help the other members find it more quickly
- Mark as New
- Bookmark
- Subscribe
- Mute
- Subscribe to RSS Feed
- Permalink
- Report Inappropriate Content
Hi , @sfernamer
Thanks for your quick response and sorry for the delay response due to my two holidays.
For your need , i think i may got a missing to your need, and i am not fully understand the "For a Full_Game and Full_Quarter column, I check the rows with the same TimeOnCourt and the same Time_Def. In this combination, there should be always only one Defensive_Five value. "
In my logic , i just check the same [TimeOnCount] and not to check the [Time_Def].
In my logic, i check the same [TimeOnCount], then i just to find the lowest Index whose [TimeOnCount] are the same and just return 1 and -1 .
And now i think the logic you need are not this , can you more explain your logic by some sample data?
Such as giving me some conditional sample data and the end result you want to get in the end?
And what the fields you need to put on the visual ?
I am not sure my understanding is the same as yours.
And for this sample data you provide , do you mean that we need to check:
(1) the [TimeOnCount] and the [Time_Def] are all the same. (YES)
(2)Then i do not know the next step to find the lowest index. In my thought , i will use the current [Full_Game] ,[Full_Quarter],[TimeOnCount],[Time_Def] to find the how many [Defensive Five] in this table? (In your sample , there are two [Defensive Five] = "PLAYER2 ..." and "PLAYER3 ...")??
(3)Then we need to get the each lowest [Index] of each [Defensive Five] ?
"PLAYER2 ..." ----- > 19242 "PLAYER3 ..."----->19257
(4)So in the end we keep the all the [Defensive Five]= "PLAYER2 ..." data ??
Thank you for your time and sharing, and thank you for your support and understanding of PowerBI!
Best Regards,
Aniya Zhang
If this post helps, then please consider Accept it as the solution to help the other members find it more quickly
- Mark as New
- Bookmark
- Subscribe
- Mute
- Subscribe to RSS Feed
- Permalink
- Report Inappropriate Content
Firstly, hope you could enjoy your holidays. Don't have to apologize, I truly appreciate all your effort to help me. I'm gonna try to reply about your understanding:
I am not sure my understanding is the same as yours.
And for this sample data you provide , do you mean that we need to check:
(1) the [TimeOnCount] and the [Time_Def] are all the same. (YES) That's correct, we need to check the rows with the same [Time_Def] and same [TimeOnCount].
(2)Then i do not know the next step to find the lowest index. In my thought , i will use the current [Full_Game] ,[Full_Quarter],[TimeOnCount],[Time_Def] to find the how many [Defensive Five] in this table? Yes. usually, the result of this check should be 1 (only one Defensive Five value) except for the specific casuistry found due to a mistake in the data entry. (In your sample , there are two [Defensive Five] = "PLAYER2 ..." and "PLAYER3 ...")?? Yes. Because it's the specific casuistry where it was an error in a data entry. Here, the result of your check it's gonna be 2 instead of 1.
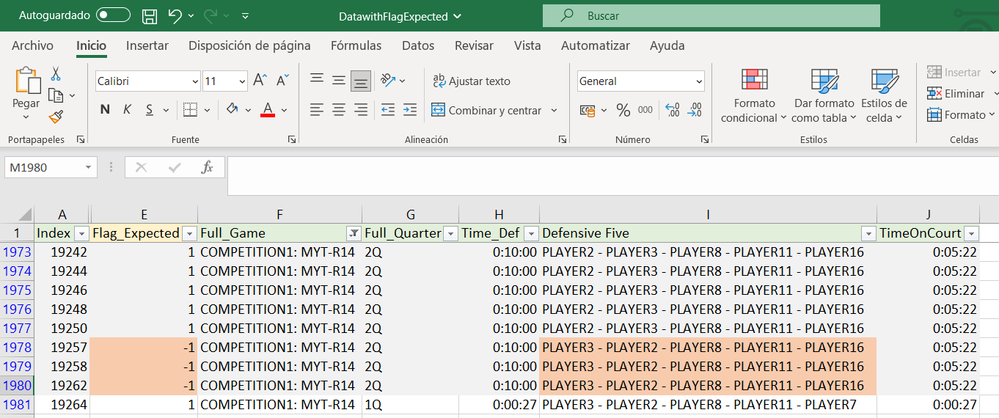
(3)Then we need to get the each lowest [Index] of each [Defensive Five] ? It could be a way to find the lowest Defensive Value for this subset (the one referred in step 1, same [Time_Def] and [TimeOnCourt]). In the end, the goal is to mark the "PLAYER2..." with 1 and the "PLAYER3..." as -1.
"PLAYER2 ..." ----- > 19242 "PLAYER3 ..."----->19257
(4)So in the end we keep the all the [Defensive Five]= "PLAYER2 ..." data ?? That's correct. We should mark all these rows for the "PLAYER2..." as 1 and all the rows "PLAYER3..." with same [Time_Def] and [TimeOnCount]. Like the example below (already added).
And what the fields you need to put on the visual ? The fields can be "DefensiveFive" or "Def3" columns, depending on the interest but I guess that if we are able to mark correctly the rows with the Flag, this could not affect us.
I do think that your understanding is the correct one. I don't know if you could access but in the link (https://drive.google.com/drive/folders/1SlzwO6bgBBgrftwrVPGRVBE9KkIy_YqJ ) you can find an Excel file with all rows of the dataset and the Flag_Expected as a result of the measure and the dated pbix with the 3 measures you told me (20220120...).
Thank you so much for your time!
- Mark as New
- Bookmark
- Subscribe
- Mute
- Subscribe to RSS Feed
- Permalink
- Report Inappropriate Content
Hi, @sfernamer
Thanks for your quick response and your patient description.
In the last , i just judge the [TimeOnCount] field and ignore the [Time_Def] field.
I re-create the statement in dax, you can try to use this.
Test_Flag 2 = var _tt =ALLSELECTED('Hoja1')
var _t = SUMMARIZE(_tt ,'Hoja1'[Index],'Hoja1'[Full_Quarter],'Hoja1'[Time_Def] , 'Hoja1'[Defensive Five] , 'Hoja1'[TimeOnCourt])
var _t2 =ADDCOLUMNS(_t, "same_flag" , var _timedef = [Time_Def] var _timroncount = [TimeOnCourt] return COUNTROWS( FILTER(_t , [Time_Def]=_timedef && [TimeOnCourt]= _timroncount)))
var _t3 =ADDCOLUMNS( _t2 , "count_defensive" , var _same_flag = [same_flag] var _timedef = [Time_Def] var _timroncount = [TimeOnCourt] var _same_table = DISTINCT( SELECTCOLUMNS( FILTER(_t , [Time_Def]=_timedef && [TimeOnCourt]= _timroncount),"five",[Defensive Five])) return COUNTROWS(_same_table))
var _t4 =ADDCOLUMNS(_t3, "min_five" , var _timedef = [Time_Def] var _timroncount = [TimeOnCourt] var _same_table =FILTER(_t , [Time_Def]=_timedef && [TimeOnCourt]= _timroncount) var _min_index =MINX(_same_table,[Index]) var _five_name =MAXX( FILTER(_same_table,[Index]=_min_index) , [Defensive Five])
return IF([count_defensive]=1,[Defensive Five], _five_name))
var _t5 =ADDCOLUMNS(_t4,"show_flag" , IF([same_flag]=1 ,1, IF([Defensive Five]=[min_five] ,1,0)))
var _cur_index= MAX('Hoja1'[Index])
var _flag = MAXX( FILTER(_t5 ,[Index]= _cur_index) , [show_flag])
return
IF(_flag=0,-1,1)
The result is as follows. i hope it will be right now!
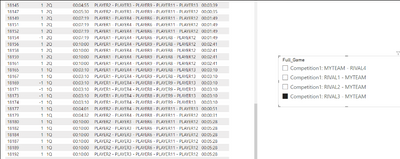
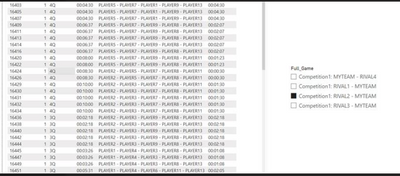
Thank you for your time and sharing, and thank you for your support and understanding of PowerBI!
Best Regards,
Aniya Zhang
If this post helps, then please consider Accept it as the solution to help the other members find it more quickly
- Mark as New
- Bookmark
- Subscribe
- Mute
- Subscribe to RSS Feed
- Permalink
- Report Inappropriate Content
I would like to ask you one last thing related to the visuals. The flag is working perfectly for DefensiveFive but, when I have to use the same for another columns like the Def3 I told you above, I have some problems working with it.
Let's see the example below, for a specific "DefensiveFive" value, I have a "Def3" value (it's the value of "DefensiveFive" but only concatenating the first, third and fifth position). Here, there are, for the same "Def3", 2 possible values of Defensive Five (it could be N values). Some of them are flagged as -1 with the Flag. How could I get the TimeOnCourt value only bearing in mind the ones marked in the flag as 1?
In the example below, the expected result for the visual in the right side above is 0:02:05 instead of the calculated 0:07:27.
When grouping the Def3 value, it's not bearing in mind that the ones marked as -1 for the DefensiveFive, should not be counted.

Thank you for your time and patience, @v-yueyunzh-msft
- Mark as New
- Bookmark
- Subscribe
- Mute
- Subscribe to RSS Feed
- Permalink
- Report Inappropriate Content
Hi , @sfernamer
Thanks for your quick response ! Do you mean the [TimeOnCount] vaule in the [Def3] context filter is wrong .
You can try to use this dax to get the [TimeOnCount] .
TimeOnCount Test = var _t  =FILTER( SUMMARIZE(ALLSELECTED('Hoja1'),'Hoja1'[Full_Quarter] , 'Hoja1'[Time_Def] , 'Hoja1'[Defensive Five] , 'Hoja1'[Def3] ,'Hoja1'[TimeOnCourt] , "flag" , [Test_Flag 2]) , [flag] = 1)
var _cur_def3 =VALUES(Hoja1[Def3])
var _t2= SUMMARIZE(_t ,[Def3],"timeoncount" ,[Grouped_TimeOnCourt_D5])
return
SUMX(FILTER(_t2,[Def3] in _cur_def3) , [timeoncount])
The result is as follows:
Thank you for your time and sharing, and thank you for your support and understanding of PowerBI!
Best Regards,
Aniya Zhang
If this post helps, then please consider Accept it as the solution to help the other members find it more quickly
- Mark as New
- Bookmark
- Subscribe
- Mute
- Subscribe to RSS Feed
- Permalink
- Report Inappropriate Content
It's working perfectly. Thank you for all your information and patience to help me.
Sergi
- Mark as New
- Bookmark
- Subscribe
- Mute
- Subscribe to RSS Feed
- Permalink
- Report Inappropriate Content
Thank you so much for your time. I checked your new measure and looks like it's working for all cases of the casuistry, so I'm gonna accept it as a solution.
Thanks again for your time.
- Mark as New
- Bookmark
- Subscribe
- Mute
- Subscribe to RSS Feed
- Permalink
- Report Inappropriate Content
To try to help people who could help me, I add a pbix file example to test with one game that shows the specific problem (due to bad data entry, not capable to correct right now).
Link pbix: https://drive.google.com/drive/folders/1SlzwO6bgBBgrftwrVPGRVBE9KkIy_YqJ?usp=share_link
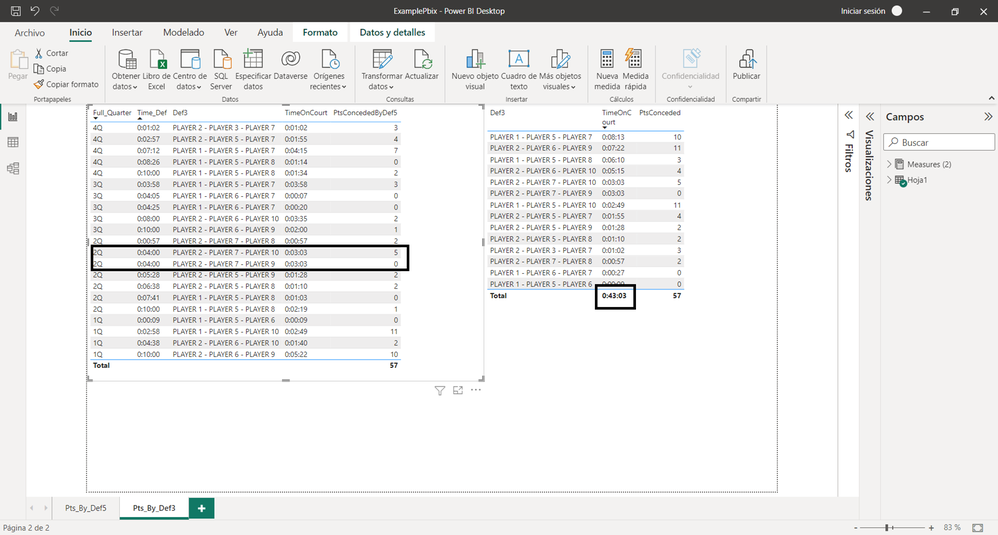
As you can see below, if there is a "TimeOnCourt" value and more than one value in other column, it shows both values. Here, the solution should be to add code to the "TimeOnCourt" calculated column to take the MIN(column Index) for these cases, but I tested to put it in different places and didn't work.
For this game, the result in second table should be 0:40:00 instead of 0:43:03. The difference, in the example, is due to the specific mistake in data entry for Full Quarter = 2Q and Time_Def= 0:04:00, but the mistake could be in a different Quarter or Time_Def in other games so the solution has to be general.
Could you give me advice, please? Thx in advance.
- Mark as New
- Bookmark
- Subscribe
- Mute
- Subscribe to RSS Feed
- Permalink
- Report Inappropriate Content
Hi , @sfernamer
Thanks for your quick response and the sample .pbix file you provieded.
You can create a measure like this:
Measure = var _tt = ALLSELECTED(Hoja1)
var _t =  SUMMARIZE(_tt , 'Hoja1'[Def3] , "TimeOnCourt" , [Grouped_TimeOnCourt_D5])
var _t2 =  ADDCOLUMNS( _t , "flag" , var _time = [TimeOnCourt] var _count = COUNTROWS(  FILTER(_t , [TimeOnCourt] = _time)) return _count)
var _t3 =  ADDCOLUMNS(_t2 , "test" , var _def3 = [Def3] var _min_index =MINX(  FILTER( _tt , [Def3]=_def3 ),[Index])  return IF([flag]>1,_min_index))
var _t4 = ADDCOLUMNS(_t3 , "test2" , var _timecount = [TimeOnCourt] var _test = MINX( FILTER(_t3 , [flag]>1 && [TimeOnCourt] =_timecount),[test]) var _min_def3 =MINX(FILTER(_tt,[Index] = _test),[Def3])
return IF(OR([Def3]=_min_def3,[flag]=1) ,1 ,-1)   )
var _cur_def3= MAX('Hoja1'[Def3])
var _test_flag =MAXX( FILTER(_t4, [Def3] = _cur_def3),[test2])
return
IF(_test_flag=-1,-1,1)
Then we can put the measure on the "Filter on this visual " and configure it and then we can meet your need:
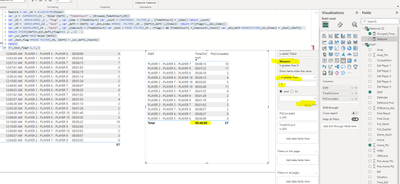
Thank you for your time and sharing, and thank you for your support and understanding of PowerBI!
Best Regards,
Aniya Zhang
If this post helps, then please consider Accept it as the solution to help the other members find it more quickly
- Mark as New
- Bookmark
- Subscribe
- Mute
- Subscribe to RSS Feed
- Permalink
- Report Inappropriate Content
Firstly, thank you for all your support and help, it's being really useful to manage this data entry mistake.
I tested your measure in the subset and worked but, when I added to the full dataset, it's marking as a Flag_Test = -1 some cases that don't have the same TimeOnCourt. I added you the new cases (basketball games) with the one you solved and 2 new tabs in the pbix to check all rows (filtered by Defender = MyTeam).
The new file is "ExamplePbix_v2.pbix" in this link (I can't add the file directly yet): https://drive.google.com/drive/folders/1SlzwO6bgBBgrftwrVPGRVBE9KkIy_YqJ?usp=share_link
Could you, please, give me advice? Thank you.
- Mark as New
- Bookmark
- Subscribe
- Mute
- Subscribe to RSS Feed
- Permalink
- Report Inappropriate Content
Hi , @sfernamer
Thanks for your quick response! And i check the sample .pbix file , you put the differnt fields so the measure can not work , if you want the first page visual work , you need to create another measure like this :
Test_Flag 2 = var _tt =ALLSELECTED('Hoja1')
var _t =  SUMMARIZE(_tt ,'Hoja1'[Full_Quarter],'Hoja1'[Time_Def] , 'Hoja1'[Defensive Five] , 'Hoja1'[TimeOnCourt])
var _t2 =  ADDCOLUMNS( _t , "flag" , var _time = [TimeOnCourt] var _count = COUNTROWS(  FILTER(_t , [TimeOnCourt] = _time)) return _count)
var _t3 =  ADDCOLUMNS(_t2 , "test" , var _def3 =[Defensive Five] var _min_index =MINX(  FILTER( _tt , [Defensive Five]=_def3 ),[Index])  return IF([flag]>1,_min_index))
var _t4 = ADDCOLUMNS(_t3 , "test2" , var _timecount = [TimeOnCourt] var _test = MINX( FILTER(_t3 , [flag]>1 && [TimeOnCourt] =_timecount),[test]) var _min_def3 =MINX(FILTER(_tt,[Index] = _test),[Defensive Five])
return IF(OR([Defensive Five]=_min_def3,[flag]=1) ,1 ,-1)   )
var _cur_def3= MAX('Hoja1'[Defensive Five])
var _test_flag =MAXX( FILTER(_t4, [Defensive Five] = _cur_def3),[test2])
return
IF(_test_flag=-1,-1,1)
Then we can get the right result :
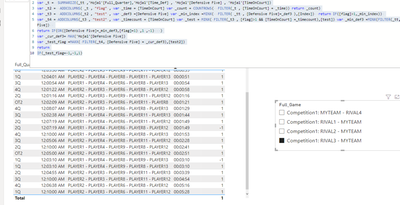
Thank you for your time and sharing, and thank you for your support and understanding of PowerBI!
Best Regards,
Aniya Zhang
If this post helps, then please consider Accept it as the solution to help the other members find it more quickly
- Mark as New
- Bookmark
- Subscribe
- Mute
- Subscribe to RSS Feed
- Permalink
- Report Inappropriate Content
Thank you for your time. Maybe the change in a column name is due to anonymization made due to the confidential data. I apologize it happened. I tested your new formula in the same pbix and still mark some test_flags as -1 whne there is only a DefensiveFive value for a TimeOnCourt value. I added your measure to the pbix and renamed it. Furthermore, I show you some examples about what I wrote above. Hope it can be useful for the explanation because I do believe the measure is quite close to the goal.
Thank you so much for your time and your tries. I'm totally aware that it's a non common question and you are doing your best to help me, so thank you so much.
Link with the pbix: https://drive.google.com/drive/folders/1SlzwO6bgBBgrftwrVPGRVBE9KkIy_YqJ?usp=share_link
2 Examples are working perfectly:
The Test_Flag2 is working as expected, detecting the same value for TimeOnCourt and different DefensiveFive values and choosing the right one (the one with MIN index, as Test_Flag2 = 1).
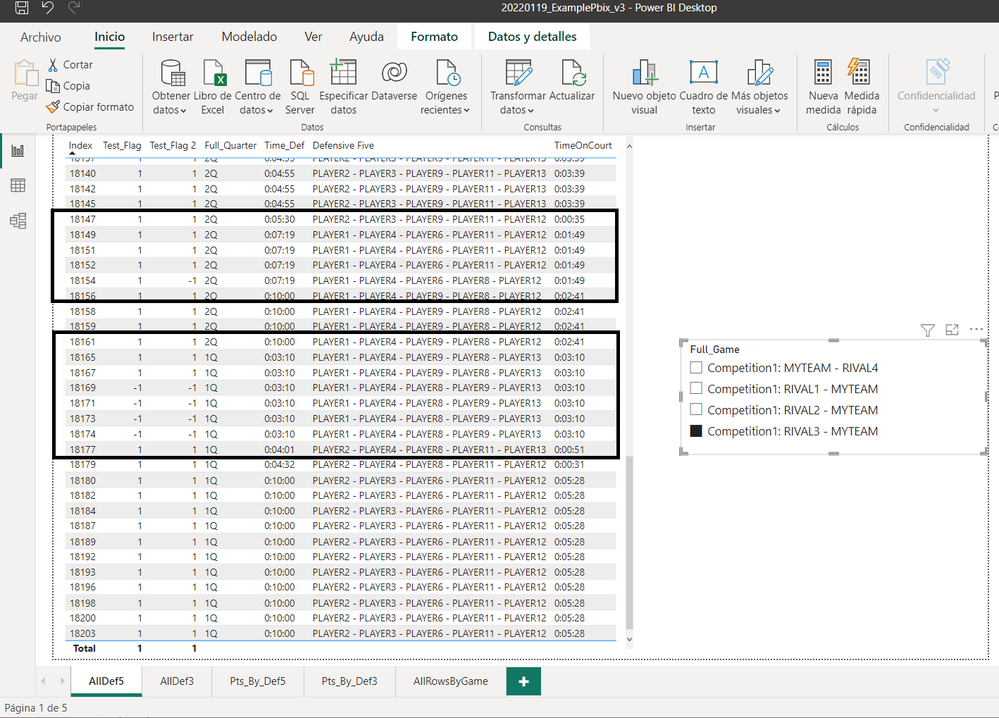
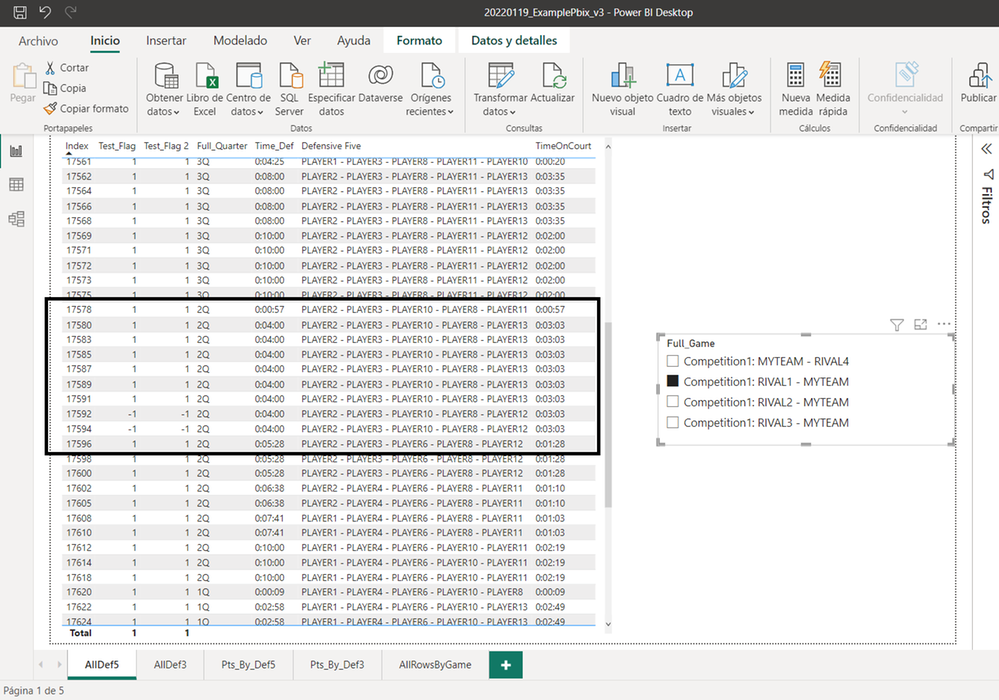
Example 2:
For the same TimeOnCourt, there is ony one DefensiveFive value but it's being marked as -1. The result of the measure should be 1, compared to the above example and the problem.
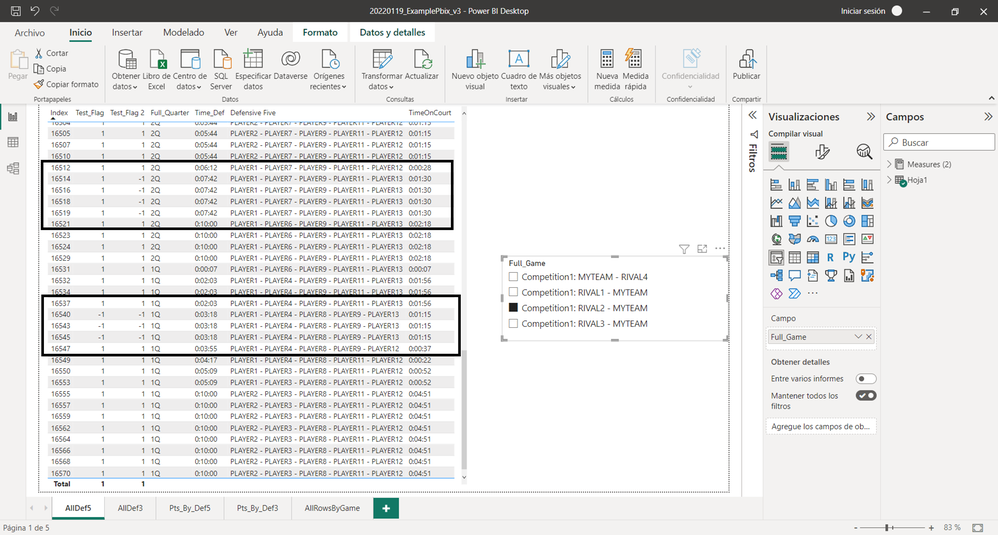
Example 3:
The Test_Flag2 is marking the row as -1 when there is only one DefensiveFive for a TimeOnCourt value. The result of the measure should be 1 for this case.
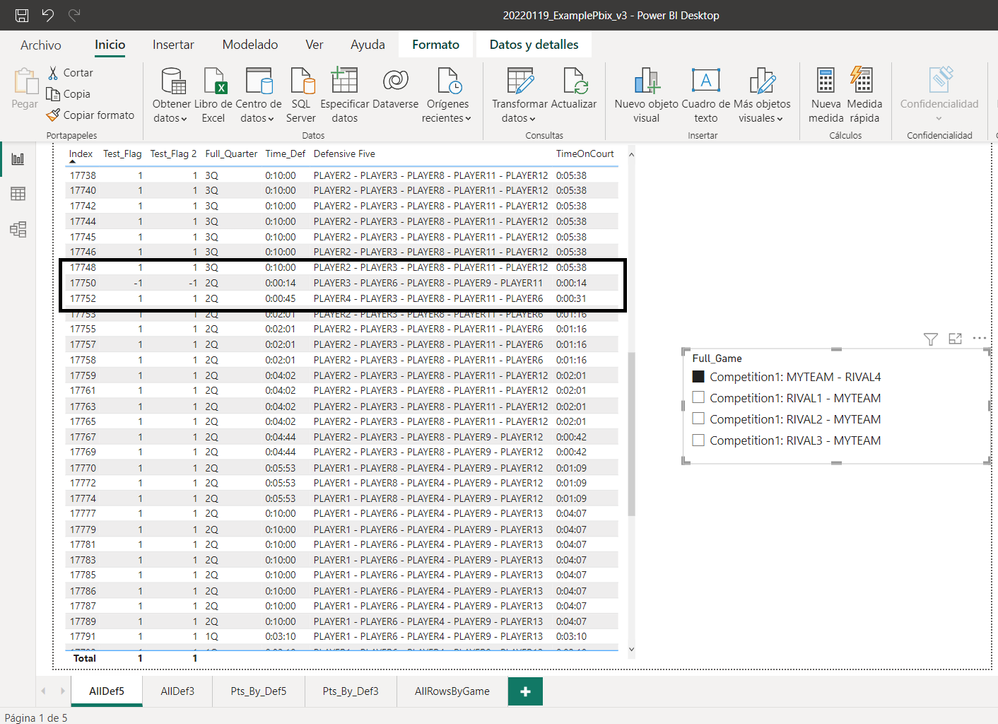
- Mark as New
- Bookmark
- Subscribe
- Mute
- Subscribe to RSS Feed
- Permalink
- Report Inappropriate Content
Hi , You can try to use this dax , i add some judgement in it:
Test_Flag 2 = var _tt =ALLSELECTED('Hoja1')
var _t =  SUMMARIZE(_tt ,'Hoja1'[Full_Quarter],'Hoja1'[Time_Def] , 'Hoja1'[Defensive Five] , 'Hoja1'[TimeOnCourt])
var _t2 =  ADDCOLUMNS( _t , "flag" , var _time = [TimeOnCourt] var _count = COUNTROWS(  FILTER(_t , [TimeOnCourt] = _time)) return _count)
var _t3 =  ADDCOLUMNS(_t2 , "test" , var _time = [TimeOnCourt] var _min_index =MINX(  FILTER( _tt ,[TimeOnCourt] = _time ),[Index])  return IF([flag]>1,_min_index))
var _t4 =ADDCOLUMNS(_t3 , "test2" , var _test = [test] var _test_table= FILTER(_tt,[Index] = _test) var _full=MAXX(_test_table,[Full_Quarter])
var _time_def = MAXX(_test_table,[Time_Def]) var _defensive =MAXX(_test_table,[Defensive Five])
return IF([flag]=1,1,IF([Full_Quarter]=_full && [Time_Def]=_time_def && [Defensive Five]=_defensive,1,-1)))
var _cur_def3= MAX('Hoja1'[Defensive Five])
var _test_flag =MAXX( FILTER(_t4, [Defensive Five] = _cur_def3),[test2])
return
IF(_test_flag=-1,-1,1)
If this method does not meet your needs, you can provide us with your special sample data and the desired output sample data in the form of tables, so that we can better help you solve the problem.
Thank you for your time and sharing, and thank you for your support and understanding of PowerBI!
Best Regards,
Aniya Zhang
If this post helps, then please consider Accept it as the solution to help the other members find it more quickly
- Mark as New
- Bookmark
- Subscribe
- Mute
- Subscribe to RSS Feed
- Permalink
- Report Inappropriate Content
Firstly, I'd like to thank your time. After checking your last measure, the flag is still not working for all cases so, following your advice, I decided to add you 2 files in the Google Drive link (https://drive.google.com/drive/folders/1SlzwO6bgBBgrftwrVPGRVBE9KkIy_YqJ ).
"20220120_ExamplePbix_v4" - Pbix with all rows of the dataset and the measures you explained to me in earlier replies.
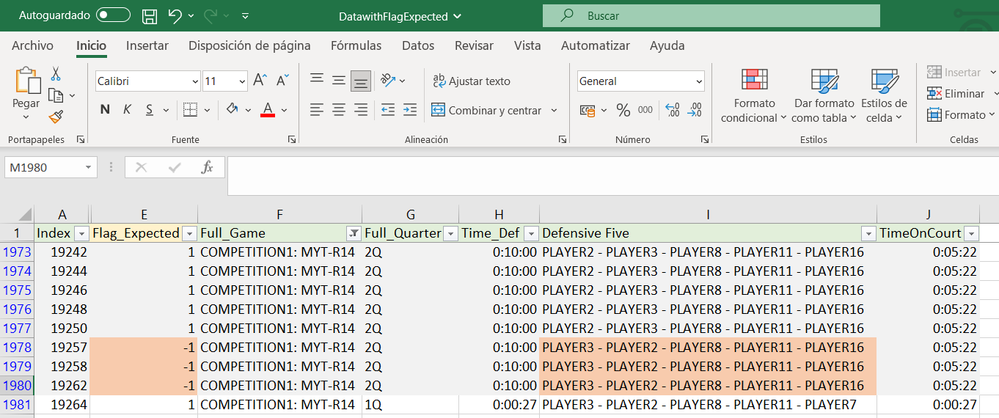
"DatawithFlagExpected" - Excel file with the column "Flag_Expected", where, after checking all rows, I put if it's 1 or -1.
The logic is the explained earlier: For a Full_Game and Full_Quarter column, I check the rows with the same TimeOnCourt and the same Time_Def. In this combination, there should be always only one Defensive_Five value. When this is not true (due to the data entry mistake), I choose the Defensive_Five value with the MIN (Index column).
Hope this can be useful for the analysis.
Sergi
- Mark as New
- Bookmark
- Subscribe
- Mute
- Subscribe to RSS Feed
- Permalink
- Report Inappropriate Content
Hi , @sfernamer
According to your description, you want to delete the row when the TimeOnCourt is the same and you need to keep the minest index row.
And thanks for the sample dat you provided.
We can click "New Table" and enter this:
Table 2 = ADDCOLUMNS( SUMMARIZE('Table','Table'[TimeOnCourt],'Table'[Time_Def],'Table'[Full_Quarter]) , "Defensive Five" ,
var _TimeOnCourt = [TimeOnCourt]  var _min_index = MINX( FILTER('Table','Table'[TimeOnCourt]=_TimeOnCourt) , [Index])
var _five =MAXX( FILTER('Table','Table'[Index] = _min_index) , [Defensive Five]) return _five)
Then we can meet your need , the result is as follows:
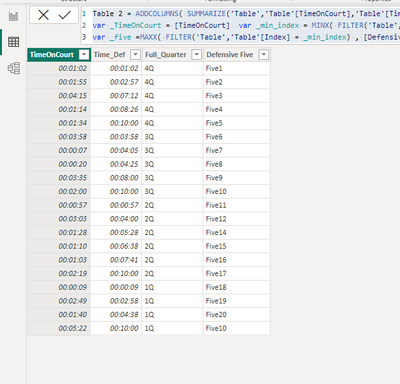
Thank you for your time and sharing, and thank you for your support and understanding of PowerBI!
Best Regards,
Aniya Zhang
If this post helps, then please consider Accept it as the solution to help the other members find it more quickly
- Mark as New
- Bookmark
- Subscribe
- Mute
- Subscribe to RSS Feed
- Permalink
- Report Inappropriate Content
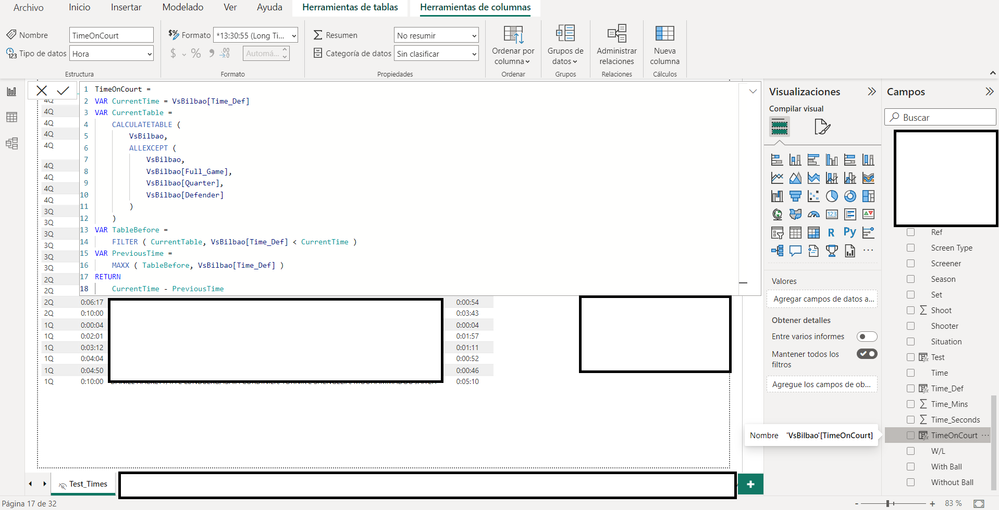
Firstly, thank you for your reply. I tested and could work but I should model tables because there are more rows that can be used for TimeOnCourt visualizations, so I would need to find the way to do the same with the formula created but not creating a new table. Add 2 examples of the full table and how the "TimeOnCourt" was created (not in Power Query, it was created in visualization panel).
Later, I would all an example of the full table for one game.

Helpful resources

Power BI Dataviz World Championships
The Power BI Data Visualization World Championships is back! Get ahead of the game and start preparing now!

Power BI Monthly Update - December 2025
Check out the December 2025 Power BI Holiday Recap!

FabCon Atlanta 2026
Join us at FabCon Atlanta, March 16-20, for the ultimate Fabric, Power BI, AI and SQL community-led event. Save $200 with code FABCOMM.

| User | Count |
|---|---|
| 19 | |
| 13 | |
| 9 | |
| 4 | |
| 4 |


| User | Count |
|---|---|
| 30 | |
| 26 | |
| 17 | |
| 11 | |
| 10 |


