Forum Discussion
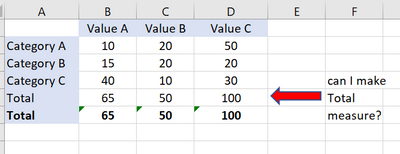
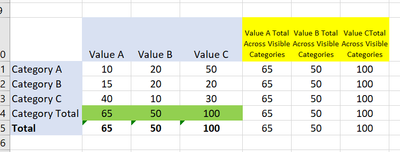
Create Measure or calculated Column for tabular Total
- 4 years ago
What you're asking for is not so easy to create. Alberto Ferrari has a vid on YT that deals with such issues. Basically, you have to create a different table with this row 'Category Total' added, connect this table to other table(s) and create a measure that will do the right thing. It's not basic stuff. If I find this video, I'll come back and give you a link. But you could try to locate it yourself on YT. Just try to search for phrases like "add total row", "add others"...
Here's something to get you started: Filtering the top products alongside the other products in Power BI - SQLBI
What you're asking for is not so easy to create. Alberto Ferrari has a vid on YT that deals with such issues. Basically, you have to create a different table with this row 'Category Total' added, connect this table to other table(s) and create a measure that will do the right thing. It's not basic stuff. If I find this video, I'll come back and give you a link. But you could try to locate it yourself on YT. Just try to search for phrases like "add total row", "add others"...
Here's something to get you started: Filtering the top products alongside the other products in Power BI - SQLBI
Ok yes this is not a DAX solution but need to do it at the query level.
Something like:
1. Make another query that aggregate category values as new category column value named "Category Total".
2. Append new query to original query. Query results will then have rows for each category, and a new row for category total.
Have to ensure that the new category "category total" is only used where relevant.