FabCon is coming to Atlanta
Join us at FabCon Atlanta from March 16 - 20, 2026, for the ultimate Fabric, Power BI, AI and SQL community-led event. Save $200 with code FABCOMM.
Register now!- Power BI forums
- Get Help with Power BI
- Desktop
- Service
- Report Server
- Power Query
- Mobile Apps
- Developer
- DAX Commands and Tips
- Custom Visuals Development Discussion
- Health and Life Sciences
- Power BI Spanish forums
- Translated Spanish Desktop
- Training and Consulting
- Instructor Led Training
- Dashboard in a Day for Women, by Women
- Galleries
- Data Stories Gallery
- Themes Gallery
- Contests Gallery
- QuickViz Gallery
- Quick Measures Gallery
- Visual Calculations Gallery
- Notebook Gallery
- Translytical Task Flow Gallery
- TMDL Gallery
- R Script Showcase
- Webinars and Video Gallery
- Ideas
- Custom Visuals Ideas (read-only)
- Issues
- Issues
- Events
- Upcoming Events
View all the Fabric Data Days sessions on demand. View schedule
- Power BI forums
- Forums
- Get Help with Power BI
- DAX Commands and Tips
- Re: Count for every day from startdate and enddate
- Subscribe to RSS Feed
- Mark Topic as New
- Mark Topic as Read
- Float this Topic for Current User
- Bookmark
- Subscribe
- Printer Friendly Page


- Mark as New
- Bookmark
- Subscribe
- Mute
- Subscribe to RSS Feed
- Permalink
- Report Inappropriate Content
Count for every day from startdate and enddate
Hi,
I have a data set witch contains every movement a patient does in the hospital.
Every movement has it's own row.
The row has an start and end date so you can determine where the patient was for every day. But how 🙂
Reference | start date | end date | department |
12345 | 1-1-2022 10:00 | 1-1-2022 15:00 | a |
12345 | 1-1-2022 15:00 | 1-1-2022 16:00 | b |
9842 | 31-1-2022 09:35 | 12-2-2022 15:34 | a |
6587 | 2-1-2022 3:25 | 3-1-2022 16:35 | a |
I want a calculation for every day (and for every hour) how many patients where present
Expected outcome for department a:
| Date | 0 | 1 | 2 | 3 | 4 | 5 | 6 | 7 | 8 | 9 | 10 | 11 | 12 | 13 | 14 | 15 | 16 | 17 | 18 | 19 | 20 | 21 | 22 | 23 |
| 1-1-2022 | 1 | 1 | 1 | 1 | 1 | 1 | 1 | 1 | 1 | 1 | 2 | 2 | 2 | 2 | 2 | 1 | 1 | 1 | 1 | 1 | 1 | 1 | 1 | 1 |
| 2-1-2022 | 1 | 1 | 1 | 2 | 2 | 2 | 2 | 2 | 2 | 2 | 2 | 2 | 2 | 2 | 2 | 2 | 2 | 2 | 2 | 2 | 2 | 2 | 2 | 2 |
The problem is that 1 reference can be present several times so the count will not be correct when I count the rows.
I hope somebody can help me.
Solved! Go to Solution.


- Mark as New
- Bookmark
- Subscribe
- Mute
- Subscribe to RSS Feed
- Permalink
- Report Inappropriate Content
Hi @bdeleur
Please refer to attached sample file with the solution
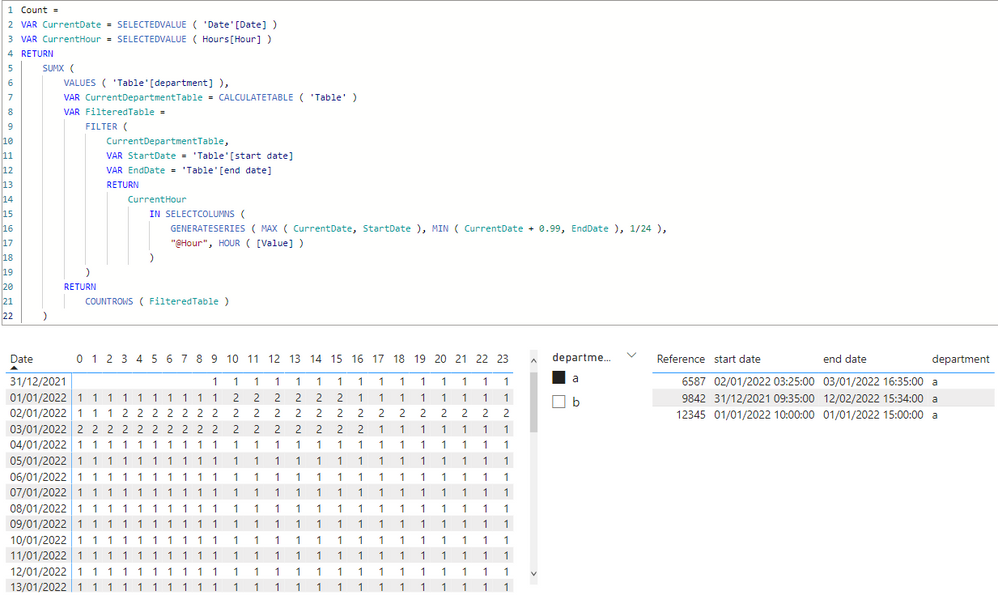
Count =
VAR CurrentDate = SELECTEDVALUE ( 'Date'[Date] )
VAR CurrentHour = SELECTEDVALUE ( Hours[Hour] )
RETURN
    SUMX (
        VALUES ( 'Table'[department] ),
        VAR CurrentDepartmentTable = CALCULATETABLE ( 'Table' )
        VAR FilteredTable =
            FILTER (
                CurrentDepartmentTable,
                VAR StartDate = 'Table'[start date]
                VAR EndDate = 'Table'[end date]
                RETURN
                    CurrentHour
                        IN SELECTCOLUMNS (
                            GENERATESERIES ( MAX ( CurrentDate, StartDate ), MIN ( CurrentDate + 0.99, EndDate ), 1/24 ),
                            "@Hour", HOUR ( [Value] )
                        )
            )
        RETURN
            COUNTROWS ( FilteredTable )
    )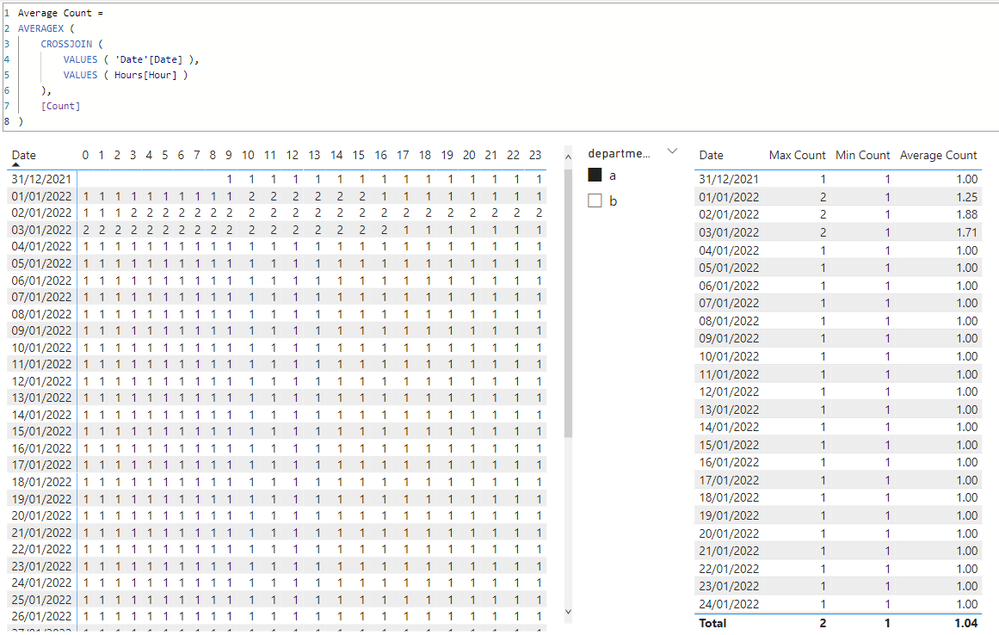
Max Count =
MAXX (
    CROSSJOIN (
        VALUES ( 'Date'[Date] ),
        VALUES ( Hours[Hour] )
    ),
    [Count]
)
Min Count =
MINX (
CROSSJOIN (
VALUES ( 'Date'[Date] ),
VALUES ( Hours[Hour] )
),
[Count]
)Average Count =
AVERAGEX (
CROSSJOIN (
VALUES ( 'Date'[Date] ),
VALUES ( Hours[Hour] )
),
[Count]
)
- Mark as New
- Bookmark
- Subscribe
- Mute
- Subscribe to RSS Feed
- Permalink
- Report Inappropriate Content
Hi @bdeleur
Please refer to attached sample file with the solution
Count =
VAR CurrentDate = SELECTEDVALUE ( 'Date'[Date] )
VAR CurrentHour = SELECTEDVALUE ( Hours[Hour] )
RETURN
    SUMX (
        VALUES ( 'Table'[department] ),
        VAR CurrentDepartmentTable = CALCULATETABLE ( 'Table' )
        VAR FilteredTable =
            FILTER (
                CurrentDepartmentTable,
                VAR StartDate = 'Table'[start date]
                VAR EndDate = 'Table'[end date]
                RETURN
                    CurrentHour
                        IN SELECTCOLUMNS (
                            GENERATESERIES ( MAX ( CurrentDate, StartDate ), MIN ( CurrentDate + 0.99, EndDate ), 1/24 ),
                            "@Hour", HOUR ( [Value] )
                        )
            )
        RETURN
            COUNTROWS ( FilteredTable )
    )
Max Count =
MAXX (
CROSSJOIN (
VALUES ( 'Date'[Date] ),
VALUES ( Hours[Hour] )
),
[Count]
)Min Count =
MINX (
CROSSJOIN (
VALUES ( 'Date'[Date] ),
VALUES ( Hours[Hour] )
),
[Count]
)Average Count =
AVERAGEX (
CROSSJOIN (
VALUES ( 'Date'[Date] ),
VALUES ( Hours[Hour] )
),
[Count]
)
- Mark as New
- Bookmark
- Subscribe
- Mute
- Subscribe to RSS Feed
- Permalink
- Report Inappropriate Content
Hi @tamerj1
Works perfect. Thank you!
I also want a min, max and average for the whole day. Is that also possible with your code?
- Mark as New
- Bookmark
- Subscribe
- Mute
- Subscribe to RSS Feed
- Permalink
- Report Inappropriate Content
- Mark as New
- Bookmark
- Subscribe
- Mute
- Subscribe to RSS Feed
- Permalink
- Report Inappropriate Content
Super!
Thank you very much. I'm very happy.

- Mark as New
- Bookmark
- Subscribe
- Mute
- Subscribe to RSS Feed
- Permalink
- Report Inappropriate Content
Beta tumse na ho payega.
- Mark as New
- Bookmark
- Subscribe
- Mute
- Subscribe to RSS Feed
- Permalink
- Report Inappropriate Content
Don't know what you mean. But the result is like this in Excel:
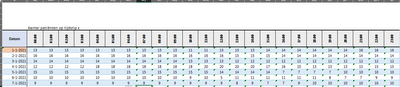
The data looks like this and contains a column Ward:

The formula I use in excel is:
AANTAL.ALS($B:$B;"<"&($K7+AL$6))-AANTAL.ALS($C:$C;"<"&($K7+AL$6))
Column B is the start date en C is the End date
Aantal.als = count.if in English.
In excel I use this formula:
- Mark as New
- Bookmark
- Subscribe
- Mute
- Subscribe to RSS Feed
- Permalink
- Report Inappropriate Content
Can you please provide more data regarding the output. Didn't understand the required output properly.
Thank you.
- Mark as New
- Bookmark
- Subscribe
- Mute
- Subscribe to RSS Feed
- Permalink
- Report Inappropriate Content
Hi @Anonymous,
Tnx for looking at my problem. I want for every day and every hour a count how many patients there are in a ward. This is an example for ward A for 2 days but it continues for the whole year and with a slicer for other wards also.
Makes it more clear now?
Helpful resources

Power BI Monthly Update - November 2025
Check out the November 2025 Power BI update to learn about new features.

Fabric Data Days
Advance your Data & AI career with 50 days of live learning, contests, hands-on challenges, study groups & certifications and more!

FabCon Atlanta 2026
Join us at FabCon Atlanta, March 16-20, for the ultimate Fabric, Power BI, AI and SQL community-led event. Save $200 with code FABCOMM.

| User | Count |
|---|---|
| 13 | |
| 9 | |
| 8 | |
| 5 | |
| 3 |


| User | Count |
|---|---|
| 28 | |
| 20 | |
| 19 | |
| 19 | |
| 12 |


