- Power BI forums
- Updates
- News & Announcements
- Get Help with Power BI
- Desktop
- Service
- Report Server
- Power Query
- Mobile Apps
- Developer
- DAX Commands and Tips
- Custom Visuals Development Discussion
- Health and Life Sciences
- Power BI Spanish forums
- Translated Spanish Desktop
- Power Platform Integration - Better Together!
- Power Platform Integrations (Read-only)
- Power Platform and Dynamics 365 Integrations (Read-only)
- Training and Consulting
- Instructor Led Training
- Dashboard in a Day for Women, by Women
- Galleries
- Community Connections & How-To Videos
- COVID-19 Data Stories Gallery
- Themes Gallery
- Data Stories Gallery
- R Script Showcase
- Webinars and Video Gallery
- Quick Measures Gallery
- 2021 MSBizAppsSummit Gallery
- 2020 MSBizAppsSummit Gallery
- 2019 MSBizAppsSummit Gallery
- Events
- Ideas
- Custom Visuals Ideas
- Issues
- Issues
- Events
- Upcoming Events
- Community Blog
- Power BI Community Blog
- Custom Visuals Community Blog
- Community Support
- Community Accounts & Registration
- Using the Community
- Community Feedback
Register now to learn Fabric in free live sessions led by the best Microsoft experts. From Apr 16 to May 9, in English and Spanish.
- Power BI forums
- Forums
- Get Help with Power BI
- DAX Commands and Tips
- Contar linhas no período entre datas
- Subscribe to RSS Feed
- Mark Topic as New
- Mark Topic as Read
- Float this Topic for Current User
- Bookmark
- Subscribe
- Printer Friendly Page
- Mark as New
- Bookmark
- Subscribe
- Mute
- Subscribe to RSS Feed
- Permalink
- Report Inappropriate Content
Contar linhas no período entre datas
Olá, poderiam ajudar com essa situação.
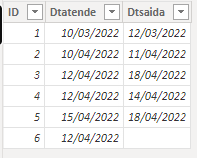
Tenho essa pequena tabela para exemplificar.
Preciso contar as linhas, para isso uso a COUNTA, e até aí tudo certo, agora vem o problema:
Imagina que estou executando um filtro no Dashboard com a data do dia 15/04/2022.
Preciso que ele conte os itens com os ID's 3, 5, 6. (total de 3)
A situação é contar os itens no estoque nessa data (15/04/2022). Então não posso considerar se entrou ou saiu dia 15, preciso considerar o período "ENTRE" das colunas dtatende e dtsaida.
Se alguém puder ajudar, serei grato. anexo está o fixeiro
- Mark as New
- Bookmark
- Subscribe
- Mute
- Subscribe to RSS Feed
- Permalink
- Report Inappropriate Content
@JeniferNunes , Assume you have disconnected date table to select dates
new measure =
var _max = maxx(allselected(Date),Date[Date])
var _min = minx(allselected(Date),Date[Date])
return
calculate( sum(Table[Value]), filter('Table', 'Table'[Start Date] <=_max && ('Table'[End Date] >=_max || isblank('Table'[End Date]) ) ))
Microsoft Power BI Learning Resources, 2023 !!
Learn Power BI - Full Course with Dec-2022, with Window, Index, Offset, 100+ Topics !!
Did I answer your question? Mark my post as a solution! Appreciate your Kudos !! Proud to be a Super User! !!
- Mark as New
- Bookmark
- Subscribe
- Mute
- Subscribe to RSS Feed
- Permalink
- Report Inappropriate Content
Olá @amitchandak obrigado por me ajudar.
Porém não deu carto aqui, não sei se entendi o que quis dizer... Veja como fiz.
Coloquei a data de ínicio no dia 12/04/2022 e só apareceu o ID "6", nem os outros ID 3 e 4, que também entram no dia12/04/2022 apareceram...
Helpful resources

Microsoft Fabric Learn Together
Covering the world! 9:00-10:30 AM Sydney, 4:00-5:30 PM CET (Paris/Berlin), 7:00-8:30 PM Mexico City

Power BI Monthly Update - April 2024
Check out the April 2024 Power BI update to learn about new features.

| User | Count |
|---|---|
| 47 | |
| 23 | |
| 20 | |
| 15 | |
| 13 |
| User | Count |
|---|---|
| 51 | |
| 42 | |
| 39 | |
| 19 | |
| 19 |


