This time we’re going bigger than ever. Fabric, Power BI, SQL, AI and more. We're covering it all. You won't want to miss it.
Learn moreLevel up your Power BI skills this month - build one visual each week and tell better stories with data! Get started
Hi to everyone, i have a cuestion with this two tables:
1. A database with the information from Employees.
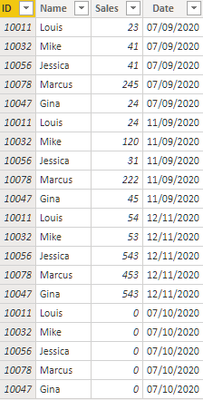
2. Sales report of each one
What i need is add a column to the table #1 with an average based on each ID employe taking the sales from the other table, if is possible add a rule that limits year by year, month to month i've been working on this for days and not having results, hope someone can know how i can work this.
Thank you very much for reading.
Solved! Go to Solution.
Sounds like you need to create a column like:
Average Sales = AVERAGEX(RELATEDTABLE('Sales'),'Sales'[Sales])
You can also wrap RELATEDTABLE with a FILTER to filter down to just the rows you want like:
Average Sales = AVERAGEX(FILTER(RELATEDTABLE('Sales'),YEAR([Date]) = 2020),'Sales'[Sales])
If this is not what you are looking for, Please see this post regarding How to Get Your Question Answered Quickly: https://community.powerbi.com/t5/Community-Blog/How-to-Get-Your-Question-Answered-Quickly/ba-p/38490
The most important parts are:
1. Sample data as text, use the table tool in the editing bar
2. Expected output from sample data
3. Explanation in words of how to get from 1. to 2.
Sounds like you need to create a column like:
Average Sales = AVERAGEX(RELATEDTABLE('Sales'),'Sales'[Sales])
You can also wrap RELATEDTABLE with a FILTER to filter down to just the rows you want like:
Average Sales = AVERAGEX(FILTER(RELATEDTABLE('Sales'),YEAR([Date]) = 2020),'Sales'[Sales])
If this is not what you are looking for, Please see this post regarding How to Get Your Question Answered Quickly: https://community.powerbi.com/t5/Community-Blog/How-to-Get-Your-Question-Answered-Quickly/ba-p/38490
The most important parts are:
1. Sample data as text, use the table tool in the editing bar
2. Expected output from sample data
3. Explanation in words of how to get from 1. to 2.
It's great thank you very much!!!!
Just a little additional cuestion how can i add another filtere that ignores "0" values this is in case that the employee isn't working that day
Thanks for reading.
Sure @Efsteps you could do something like:
Average Sales = AVERAGEX(FILTER(RELATEDTABLE('Sales'),YEAR([Date]) = 2020 && [Sales] <> 0),'Sales'[Sales])
Check out the April 2026 Power BI update to learn about new features.
Sign up to receive a private message when registration opens and key events begin.
If you have recently started exploring Fabric, we'd love to hear how it's going. Your feedback can help with product improvements.
| User | Count |
|---|---|
| 4 | |
| 4 | |
| 3 | |
| 3 | |
| 3 |
| User | Count |
|---|---|
| 9 | |
| 8 | |
| 8 | |
| 6 | |
| 6 |