Forum Discussion

Custom Power BI Table to display measures in Rows
Hi Guys,
I am using Imported Power BI file and has 5 tables in it and related to each other as per the requirement. I've created all the required measures on the model. Now, my question is to display those measures as per the Business necessity. here's how they wanted to look like... all these measures will be sliced by Filter Consisting of Zip Codes init. Need to pin this visual in Dasboard.

For example, To display ForecastYOY row... I've created 2 measures to display ForecastYOY ($) and ForecastYOY % Change.
I was unable to display all these measures in the above table format. Is there anyway to display like that or should i go for creating my own custom visual, if so how can i acheive that ?.
I have used PowerKPI Metrics to display first 5 rows and the rest of the 2 column names itself are dynamic which tends to change based on filter appiled (Date part in the column). Is there anyway that i can acheive in the same visual. I tried to move the date part from the column name to value but it's not displaying because the datatype in currency whereas we are trying ti insert date into it.
This how far I can go by using that custom visual...
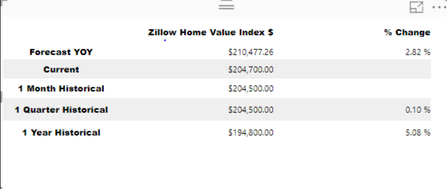
Any help is greatly appreciated!
It seems you should use a DAX query to build a column that meets your requirements.
After that you would need to put this column into Row-based Metric Name if you use Row based data.
As an alternative you might turn off metric name column and use Category data field instead.
Ignat Vilesov,
Software Engineer
Microsoft Power BI Custom Visuals

10 Replies
- v-viigCommunity Champion
Hi Anonymous
If my undertstanding is cirrect you wants to show dates. Is that correct?
If this is correct you should turn on As of Date column via Format Panel.
Ignat Vilesov,
Software Engineer
Microsoft Power BI Custom Visuals
- AnonymousNot applicable
Thanks for the Response.
No, I want to display the Metric Name having fixed Text (Historical Min) and concatenating with variable measure which brings back different dates based on the filters applied So my requirement is typically to create a dynamic measure name...
I know how to create a dynamic measure name but I can't retrofit into this visual as per my needs.
Let me know if I miss any thing.
- v-viigCommunity Champion
It seems you should use a DAX query to build a column that meets your requirements.
After that you would need to put this column into Row-based Metric Name if you use Row based data.
As an alternative you might turn off metric name column and use Category data field instead.
Ignat Vilesov,
Software Engineer
Microsoft Power BI Custom Visuals