- Power BI forums
- Updates
- News & Announcements
- Get Help with Power BI
- Desktop
- Service
- Report Server
- Power Query
- Mobile Apps
- Developer
- DAX Commands and Tips
- Custom Visuals Development Discussion
- Health and Life Sciences
- Power BI Spanish forums
- Translated Spanish Desktop
- Power Platform Integration - Better Together!
- Power Platform Integrations (Read-only)
- Power Platform and Dynamics 365 Integrations (Read-only)
- Training and Consulting
- Instructor Led Training
- Dashboard in a Day for Women, by Women
- Galleries
- Community Connections & How-To Videos
- COVID-19 Data Stories Gallery
- Themes Gallery
- Data Stories Gallery
- R Script Showcase
- Webinars and Video Gallery
- Quick Measures Gallery
- 2021 MSBizAppsSummit Gallery
- 2020 MSBizAppsSummit Gallery
- 2019 MSBizAppsSummit Gallery
- Events
- Ideas
- Custom Visuals Ideas
- Issues
- Issues
- Events
- Upcoming Events
- Community Blog
- Power BI Community Blog
- Custom Visuals Community Blog
- Community Support
- Community Accounts & Registration
- Using the Community
- Community Feedback
Register now to learn Fabric in free live sessions led by the best Microsoft experts. From Apr 16 to May 9, in English and Spanish.
- Power BI forums
- Galleries
- COVID-19 Data Stories Gallery
- Re: Covid19 tenant risk analysis with bim model
Re: Covid19 tenant risk analysis with bim model
05-01-2020 08:09 AM


- Mark as New
- Bookmark
- Subscribe
- Mute
- Subscribe to RSS Feed
- Permalink
- Report Inappropriate Content
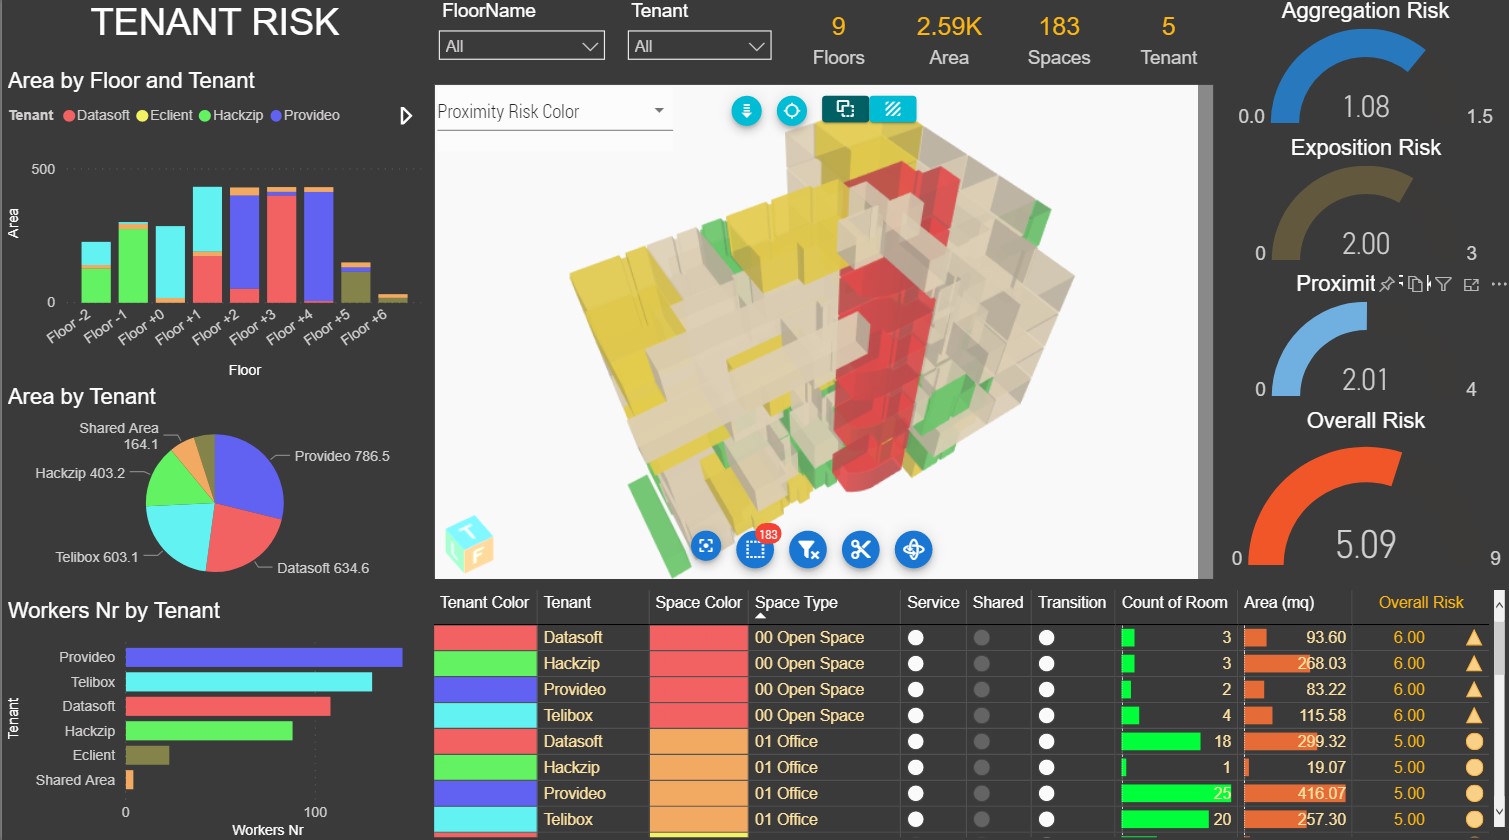
Covid19 tenant risk analysis with bim model
This example focuses on risk analysis by tenant. In the report we show the distribution of tenants on the floors of a building and the area occupied.
We can go into the detail of the risk by filtering based on spaces or risk type indices such as aggregation, exposure and proximity. We can choose to apply the color by tenant or risk using the color selector in the custom visual depending on which aspect we want to highlight.
Subscribe at http://bit.ly/396T90d to try Vcad ifc custo mvisual for Power BI
eyJrIjoiZDIxOTgwOGQtNmNlOS00NTJmLWE2NWUtYzU4ZWNkOWI0MTFjIiwidCI6IjkyNWJkNTViLTA1MjEtNDAwMy1iN2M5LWMzZTY4MzY3ZDcyNCIsImMiOjh9
- Mark as New
- Bookmark
- Subscribe
- Mute
- Subscribe to RSS Feed
- Permalink
- Report Inappropriate Content
Awesome work.. It is possible to share the pbix file with me so that I can explore more and learn new things as well.
My email id is mdaamir200@gmail.co