- Power BI forums
- Updates
- News & Announcements
- Get Help with Power BI
- Desktop
- Service
- Report Server
- Power Query
- Mobile Apps
- Developer
- DAX Commands and Tips
- Custom Visuals Development Discussion
- Health and Life Sciences
- Power BI Spanish forums
- Translated Spanish Desktop
- Power Platform Integration - Better Together!
- Power Platform Integrations (Read-only)
- Power Platform and Dynamics 365 Integrations (Read-only)
- Training and Consulting
- Instructor Led Training
- Dashboard in a Day for Women, by Women
- Galleries
- Community Connections & How-To Videos
- COVID-19 Data Stories Gallery
- Themes Gallery
- Data Stories Gallery
- R Script Showcase
- Webinars and Video Gallery
- Quick Measures Gallery
- 2021 MSBizAppsSummit Gallery
- 2020 MSBizAppsSummit Gallery
- 2019 MSBizAppsSummit Gallery
- Events
- Ideas
- Custom Visuals Ideas
- Issues
- Issues
- Events
- Upcoming Events
- Community Blog
- Power BI Community Blog
- Custom Visuals Community Blog
- Community Support
- Community Accounts & Registration
- Using the Community
- Community Feedback
Register now to learn Fabric in free live sessions led by the best Microsoft experts. From Apr 16 to May 9, in English and Spanish.
- Power BI forums
- Galleries
- COVID-19 Data Stories Gallery
- COVID-19: Reporte Colombia y el resto del mundo
COVID-19: Reporte Colombia y el resto del mundo
05-24-2020 13:08 PM - last edited 09-27-2023 08:21 AM


- Mark as New
- Bookmark
- Subscribe
- Mute
- Subscribe to RSS Feed
- Permalink
- Report Inappropriate Content
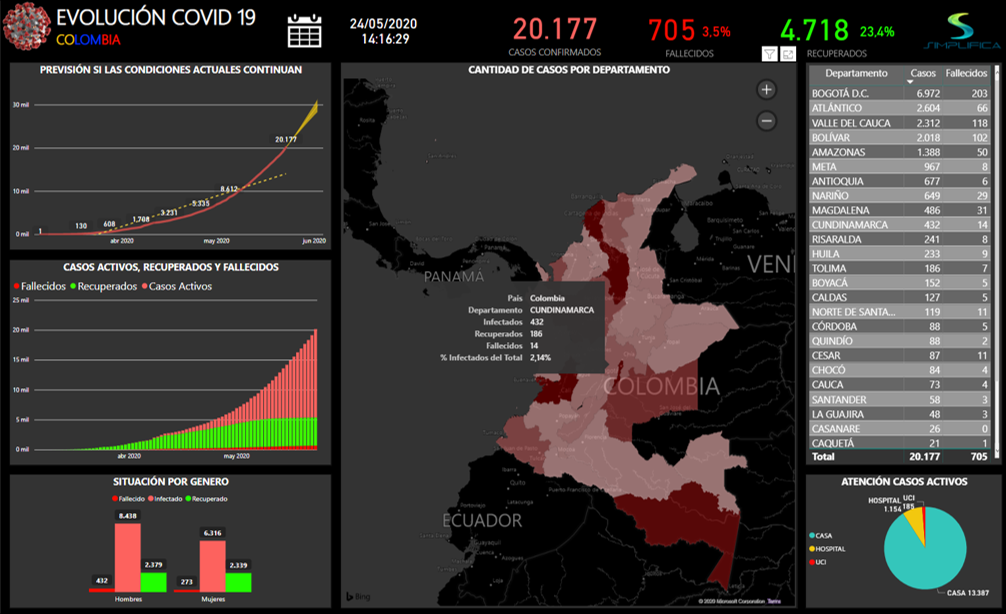
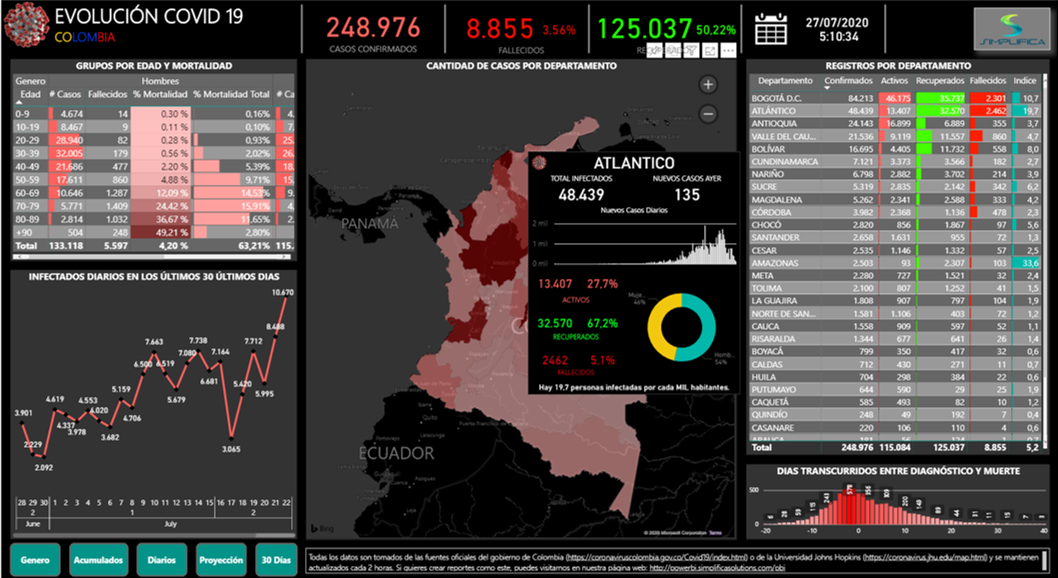
COVID-19: Reporte Colombia y el resto del mundo
Reporte que consolida la información diaria de la evolución del COVID-19 en Colombia y el mundo.
Para colombia, los datos son recolectados de la fuente oficial:
Los datos son recolectados de para el avance en todo el mundo
Se incluyen datos de la evolución en todos los países, así como por continentes. para América, se tiene un comparativo de la región, incluyendo el índice de afectación de la población por país.
Agradecemos cualquier comentario o sugerencia para seguir modificándolo.
Tenemos 7 reportes publicados en la comunidad:
- Simplifica: Colores básicos estilo Microsoft.
- Simplifica - Otoño - autumn: Versión actualizada de este reporte con colores de Otoño.
- Infographic-Designer-Report: ejemplos de combinaciones que pueden realizarse con Infographic
- COVID-19 Report Colombia: Estado actual de COVID-19 en colombia y el mundo.
- Titanic Data Analysis: Análisis de datos sobre el hundimiento del Titanic.
- Games of Thrones Report Analysis: Análisis de datos de las 8 temporadas de Juego de Tronos.
- Análisis PIB Per Capita - Banco Mundial: Análisis mundial de PIB per capita según el banco mundial a corte del 2021
- SVG para Power BI: Reporte de Power BI con ideas geniales de imágenes SVG para utilizar en tablas, matrices y tarjetas avanzadas.
Agradecemos sus kudos y comentarios.
eyJrIjoiOWViMGY2NWMtYzhhNi00MzFkLWE2MDQtODZlYzE2MzU2NTdjIiwidCI6IjM2OTBjNGY3LTIyYzgtNDRkYy04YjljLTc1YzAwYzE0NzczZiIsImMiOjR9