- Power BI forums
- Updates
- News & Announcements
- Get Help with Power BI
- Desktop
- Service
- Report Server
- Power Query
- Mobile Apps
- Developer
- DAX Commands and Tips
- Custom Visuals Development Discussion
- Health and Life Sciences
- Power BI Spanish forums
- Translated Spanish Desktop
- Power Platform Integration - Better Together!
- Power Platform Integrations (Read-only)
- Power Platform and Dynamics 365 Integrations (Read-only)
- Training and Consulting
- Instructor Led Training
- Dashboard in a Day for Women, by Women
- Galleries
- Community Connections & How-To Videos
- COVID-19 Data Stories Gallery
- Themes Gallery
- Data Stories Gallery
- R Script Showcase
- Webinars and Video Gallery
- Quick Measures Gallery
- 2021 MSBizAppsSummit Gallery
- 2020 MSBizAppsSummit Gallery
- 2019 MSBizAppsSummit Gallery
- Events
- Ideas
- Custom Visuals Ideas
- Issues
- Issues
- Events
- Upcoming Events
- Community Blog
- Power BI Community Blog
- Custom Visuals Community Blog
- Community Support
- Community Accounts & Registration
- Using the Community
- Community Feedback
Register now to learn Fabric in free live sessions led by the best Microsoft experts. From Apr 16 to May 9, in English and Spanish.
- Power BI forums
- Galleries
- COVID-19 Data Stories Gallery
- #COVID-19 Dashboard - From Data to Insights
#COVID-19 Dashboard - From Data to Insights
03-27-2020 02:23 AM - last edited 03-27-2020 10:27 AM


- Mark as New
- Bookmark
- Subscribe
- Mute
- Subscribe to RSS Feed
- Permalink
- Report Inappropriate Content
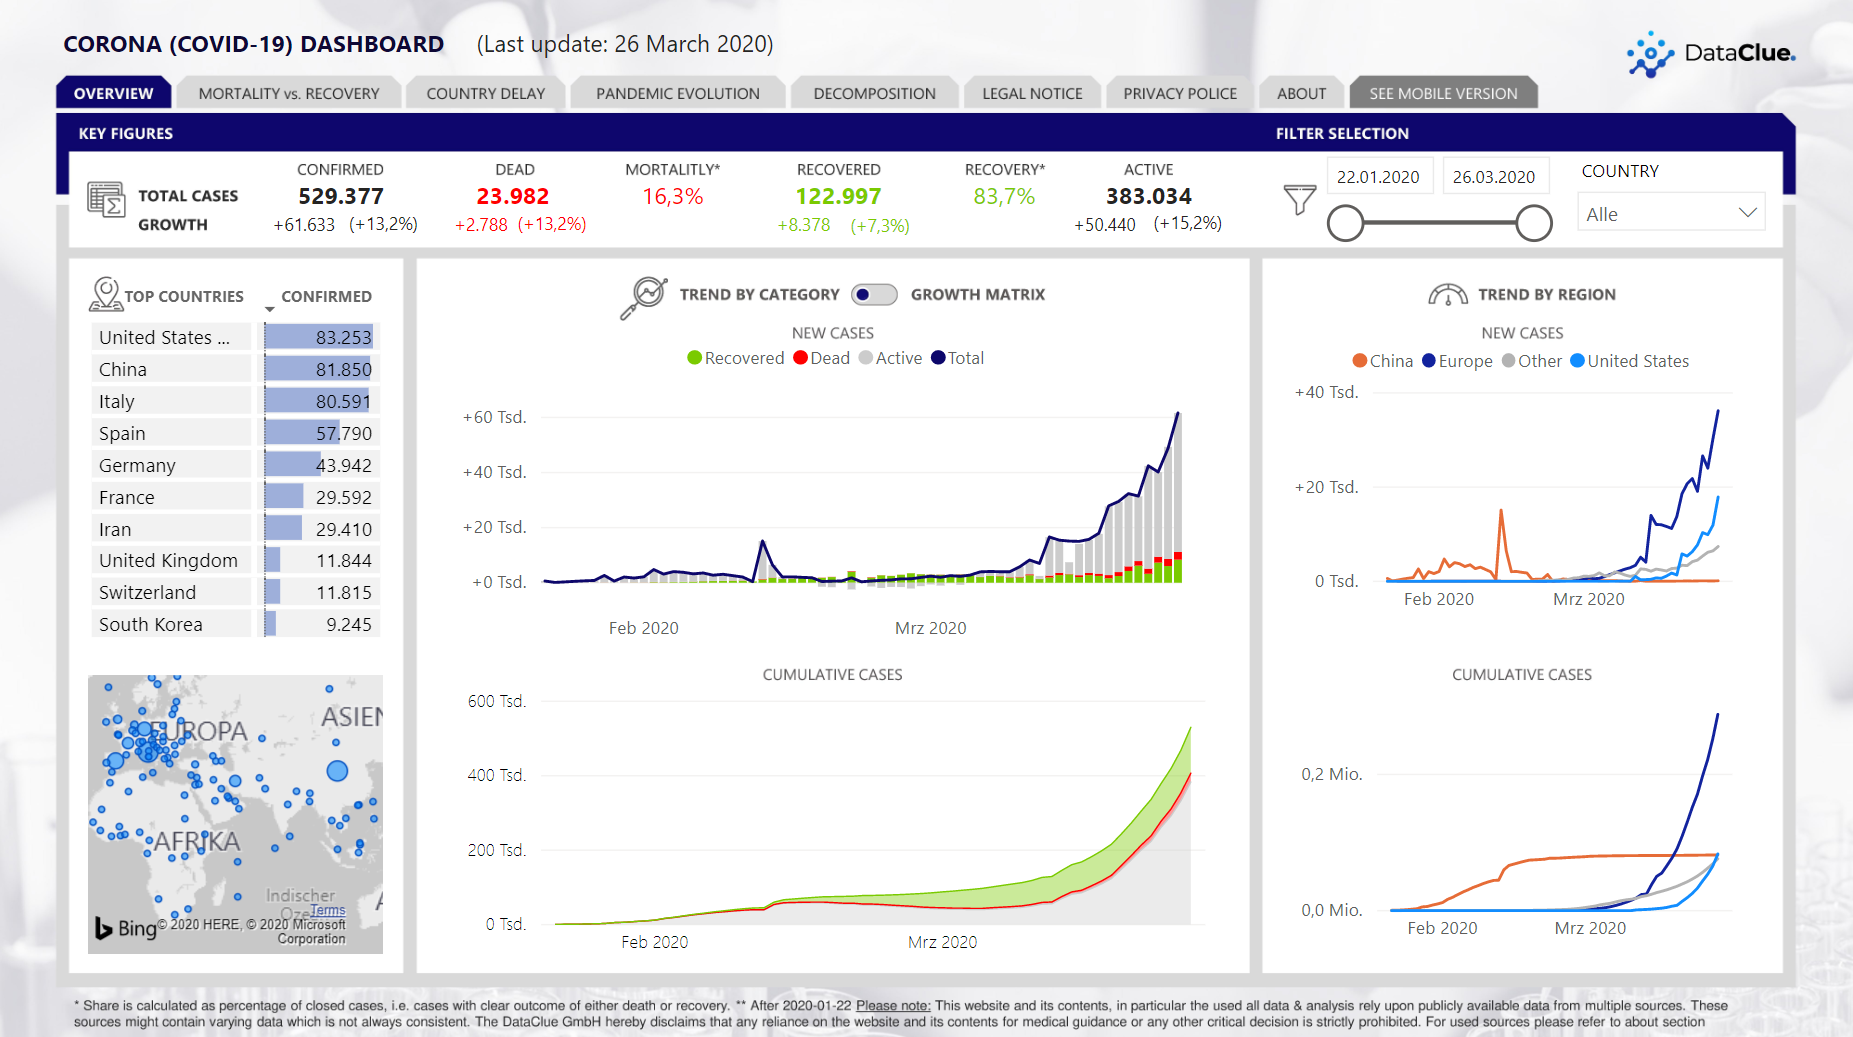
#COVID-19 Dashboard - From Data to Insights
#COVID19 Dashboard - From Data to Insights:
The COVID19 Dashboard provides a comprehensive overview of the key metrics of the global pandemic, their current developments and detailed analyses on country level.
The dashboard is available in two versions:
- Mobile version: A smartphone optimized overview of core metrics (https://corona.dataclue.bi)
- Tablet & Desktop version: Core metrics as well as detailed analyses about development and current spread of the pandemic (https://corona.dataclue.bi/desktop/)
In both versions users can quickly get an overview and check most essential KPIs and filter by their respective country of interest.
The dashboard provides valuable insights on cases (active, dead, recovered), mortality and recovery rates by country and selected timeframe. Generally, both cumulative numbers and new cases are provided.
The dashboard design provides users with an effective management summary of the most relevant KPIs as well as detailed analyses on separate report pages.
Using the Corona example, the dashboard shows the strengths of our business intelligence solutions with Power BI: an intuitive visualization which makes even complex data sets more comprehensible. Current developments, interdependencies and key drivers in the data can be easily identified and comprehensively monitored. This enables a data-driven decision-making.
The DataClue team consists of an interdisciplinary team of data scientist, designers and business consultants. This enables us to create holistic business intelligence dashboards which provide actionable insights from your data and thus creates a data-driven basis for smarter decisions.
Do you have an overview of your most essential KPIs in the context of the current crisis?
If not, we are happy to help you using PowerBI to make urgent data-driven decisions.
#covid19 #corona #businessintelligence #powerbi #visualanalytics #dashboard #datastory #FromDataToInsightsToValue #DataPotential
eyJrIjoiYjA1YzhhMjItMWU1ZS00YmRiLWI3MjUtZDVhN2ZlMzY4NjFlIiwidCI6IjJjOTJmZjI0LWI0MmMtNDgwZC1iNzRkLTY2ZmNlNzZiZDdkYSIsImMiOjl9