Forum Discussion

Syndicate_Admin
4 years agoAdministrator
Time filter help
Hello Community,
For several days I have been dealing with a filter. I have a small calendar table, where I also have a column "Relative_cod" that goes from number 1 to 24, with 1 being the number of the most current month and 24 the oldest.
Now, I create a measure for my QTR (in Tableau) more or less like that (with the 24 months)
QTR = IF([RELATIVE_CODE] >= 1 && [RELATIVE_CODE]<= 4, [MTH],
IF([RELATIVE_CODE] >= 4 && [RELATIVE_CODE] < 7, DATEADD(Period[DATE],-21,MONTH),
IF([RELATIVE_CODE]>=7 && [RELATIVE_CODE]<10, DATEADD(Period[DATE],-18,MONTH)
With that measure, by filtering by 'QTR' I can see my charts like this.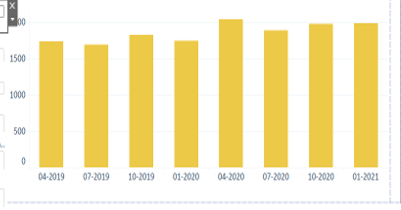
How could I achieve the same in Power bi? I have already created a measure and a table, pass my measure to the table
Medida_FILTRO = IF(HASONEFILTER(FILTER[Measure]),
SWITCH(
VALUES(FILTER[ID_medida]),
1,[QTR])))
But as I said before, I can't see QTR like in Tableau. I hope you can help me
2 Replies
- lbendlinSuper User
QTR = SWITCH(TRUE(),[RELATIVE_CODE]<= 4, [MTH], [RELATIVE_CODE] < 7, DATEADD(Period[DATE],-21,MONTH), [RELATIVE_CODE]<10, DATEADD(Period[DATE],-18,MONTH), <some value for "else">)  Syndicate_AdminAdministrator
Thank you for your reply, but I still don't achieve the result I expect. Using DATEADD I only move the months but I do not bring the total accumulated of the quarter
